QUESTION IMAGE
Question
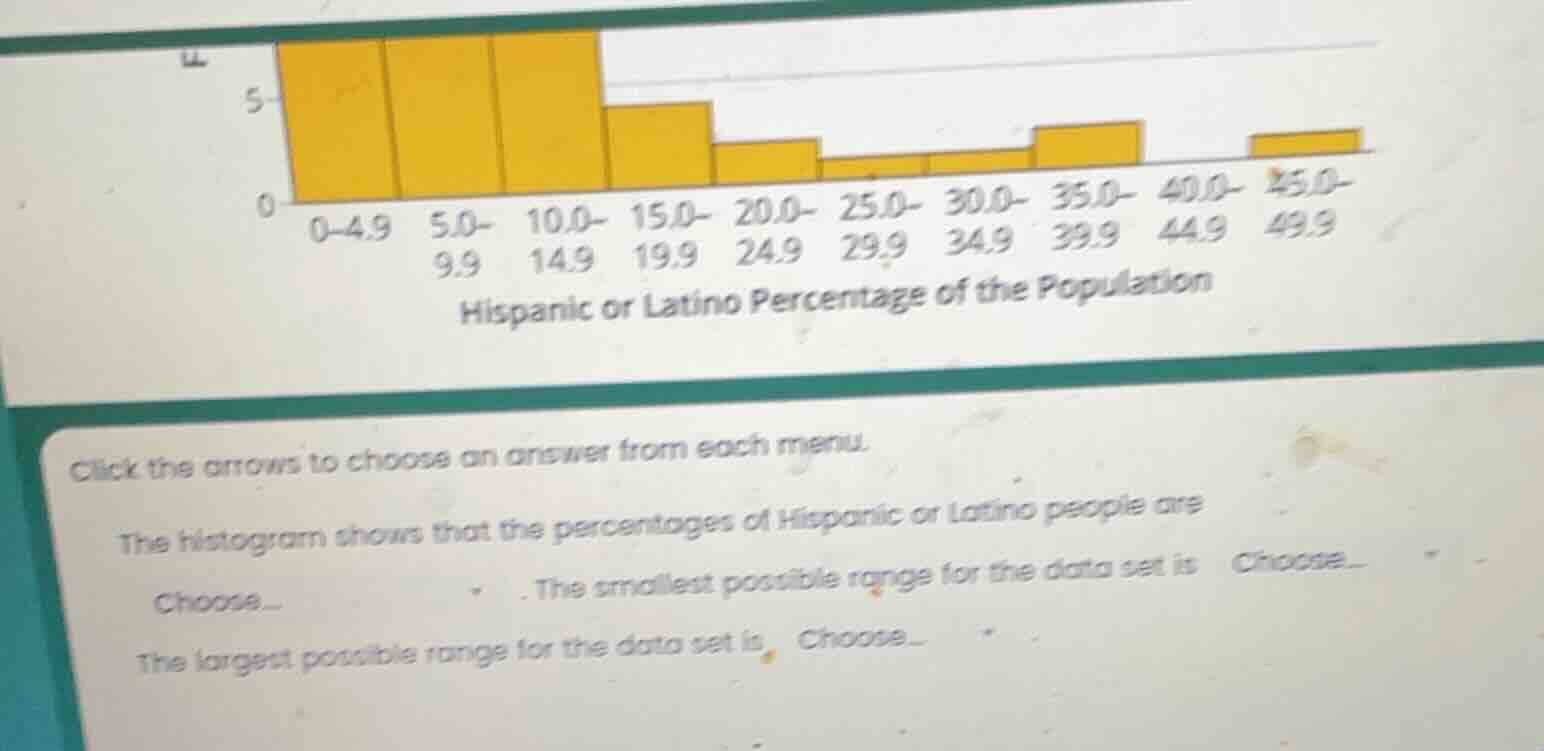
click the arrows to choose an answer from each menu. the histogram shows that the percentages of hispanic or latino people are choose... . the smallest possible range for the data set is choose... . the largest possible range for the data set is choose... .
Step1: Describe data distribution
The histogram has the tallest bars in the lowest percentage intervals (0-4.9, 5.0-9.9, 10.0-14.9), so the percentages are skewed right (concentrated at lower values).
Step2: Calculate min possible range
Range = max value - min value. For smallest range, use smallest max (45.0) and largest min (0).
$\text{Smallest Range} = 45.0 - 0 = 45.0$
Step3: Calculate max possible range
For largest range, use largest max (49.9) and smallest min (0).
$\text{Largest Range} = 49.9 - 0 = 49.9$

Snap & solve any problem in the app
Get step-by-step solutions on Sovi AI
Photo-based solutions with guided steps
Explore more problems and detailed explanations
- The percentages of Hispanic or Latino people are skewed to the right (concentrated at lower values)
- The smallest possible range for the data set is $\boldsymbol{45.0}$
- The largest possible range for the data set is $\boldsymbol{49.9}$