QUESTION IMAGE
Question
current skill
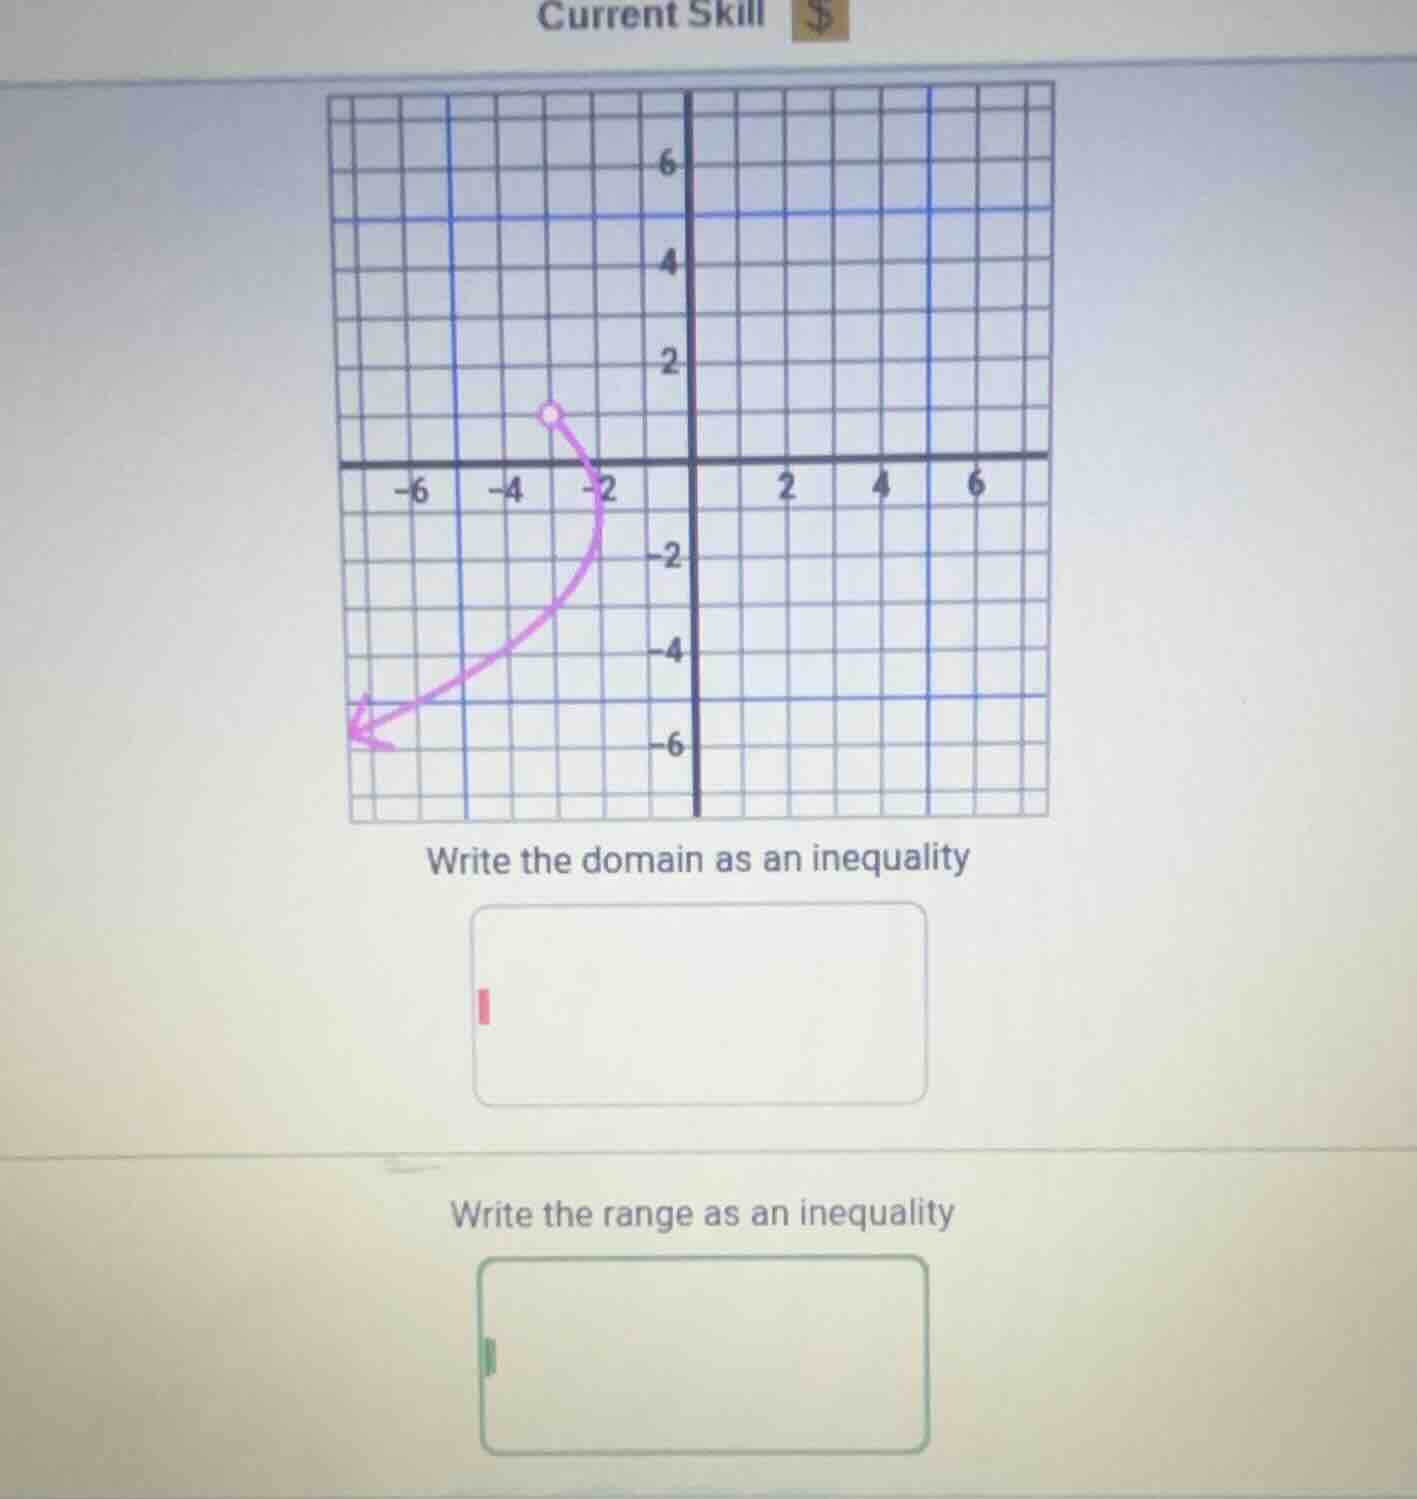
write the domain as an inequality
write the range as an inequality
Step1: Determine the domain
The domain of a graph is the set of all x - values for which the graph exists. Looking at the graph, the left - most point (the starting point of the curve, which is an open circle at \(x=-3\) (wait, let's check the grid again. Wait, the open circle is at \(x = - 3\)? Wait, no, looking at the grid, the x - coordinate of the open circle: let's see the grid lines. The open circle is at \(x=-3\)? Wait, no, the x - axis has grid lines. Let's see, the open circle is at \(x=-3\)? Wait, the graph is a curve that starts at an open circle (so not including that point) and goes to the left (since the arrow is pointing left). Wait, the x - coordinate of the open circle: let's count the grid squares. From the origin (0,0), moving left: each grid square is 1 unit. The open circle is at \(x=-3\)? Wait, no, looking at the x - axis labels: -6, -4, -2, 0, 2, 4, 6. Wait, the open circle is at \(x=-3\)? Wait, no, the x - coordinate of the open circle: let's see, the x - value of the open circle is -3? Wait, no, the x - axis: the distance between -4 and -2 is 2 units, so each grid square is 1 unit. So the open circle is at \(x=-3\)? Wait, no, the open circle is at \(x=-3\)? Wait, no, the x - coordinate of the open circle: let's look at the graph. The curve starts at an open circle (so the x - value of that point is not included) and extends to the left (so x can be any value less than or equal to that x - value? Wait, no, the arrow is pointing left, so as we move left, x becomes more negative. Wait, the domain is the set of all x - values that the graph covers. The graph starts at an open circle (so the x - value of the open circle is not included) and goes to the left (so x can be any value less than that x - value? Wait, no, wait: the open circle is at \(x=-3\) (let's confirm: the x - coordinate of the open circle: from the origin, moving left 3 units, so x=-3). The graph is a curve that goes from x=-3 (not included, since it's an open circle) and extends to the left (so x can be any real number less than -3? Wait, no, wait: the arrow is pointing left, which means as x decreases (becomes more negative), the graph exists. Wait, no, the domain is the set of x - values. So the left - most direction is towards negative infinity, and the right - most point is the open circle at x=-3 (not included). So the domain is all real numbers x such that \(x < - 3\)? Wait, no, wait, let's check the graph again. Wait, the open circle is at ( - 3,1)? Wait, no, the y - coordinate of the open circle: looking at the y - axis, the open circle is at y = 1? Wait, no, the y - axis has 0, 2, -2, etc. Wait, the open circle is at ( - 3,1)? Wait, no, the x - coordinate: let's see, the x - axis: the open circle is at x=-3 (since between -4 and -2, the open circle is at x=-3). So the domain is all x - values less than -3? Wait, no, wait: the graph is a curve that starts at the open circle (x=-3, not included) and goes to the left (so x can be any value less than -3? Wait, no, when the arrow is pointing left, that means as x approaches negative infinity, the graph is defined. So the domain is \(x < - 3\)? Wait, no, wait, maybe I made a mistake. Wait, the open circle is at x=-3 (so x=-3 is not included), and the graph extends to the left (so x can be any real number less than -3? Wait, no, that can't be. Wait, maybe the open circle is at x=-3, and the graph includes all x - values less than or equal to -3? No, because it's an open circle, so x=-3 is not included. So the domain is \(x < - 3\)? Wait, no, wait, let's re - examine. The x - coordinate of the…

Snap & solve any problem in the app
Get step-by-step solutions on Sovi AI
Photo-based solutions with guided steps
Explore more problems and detailed explanations
Step1: Determine the domain
The domain of a graph is the set of all x - values for which the graph exists. Looking at the graph, the left - most point (the starting point of the curve, which is an open circle at \(x=-3\) (wait, let's check the grid again. Wait, the open circle is at \(x = - 3\)? Wait, no, looking at the grid, the x - coordinate of the open circle: let's see the grid lines. The open circle is at \(x=-3\)? Wait, no, the x - axis has grid lines. Let's see, the open circle is at \(x=-3\)? Wait, the graph is a curve that starts at an open circle (so not including that point) and goes to the left (since the arrow is pointing left). Wait, the x - coordinate of the open circle: let's count the grid squares. From the origin (0,0), moving left: each grid square is 1 unit. The open circle is at \(x=-3\)? Wait, no, looking at the x - axis labels: -6, -4, -2, 0, 2, 4, 6. Wait, the open circle is at \(x=-3\)? Wait, no, the x - coordinate of the open circle: let's see, the x - value of the open circle is -3? Wait, no, the x - axis: the distance between -4 and -2 is 2 units, so each grid square is 1 unit. So the open circle is at \(x=-3\)? Wait, no, the open circle is at \(x=-3\)? Wait, no, the x - coordinate of the open circle: let's look at the graph. The curve starts at an open circle (so the x - value of that point is not included) and extends to the left (so x can be any value less than or equal to that x - value? Wait, no, the arrow is pointing left, so as we move left, x becomes more negative. Wait, the domain is the set of all x - values that the graph covers. The graph starts at an open circle (so the x - value of the open circle is not included) and goes to the left (so x can be any value less than that x - value? Wait, no, wait: the open circle is at \(x=-3\) (let's confirm: the x - coordinate of the open circle: from the origin, moving left 3 units, so x=-3). The graph is a curve that goes from x=-3 (not included, since it's an open circle) and extends to the left (so x can be any real number less than -3? Wait, no, wait: the arrow is pointing left, which means as x decreases (becomes more negative), the graph exists. Wait, no, the domain is the set of x - values. So the left - most direction is towards negative infinity, and the right - most point is the open circle at x=-3 (not included). So the domain is all real numbers x such that \(x < - 3\)? Wait, no, wait, let's check the graph again. Wait, the open circle is at ( - 3,1)? Wait, no, the y - coordinate of the open circle: looking at the y - axis, the open circle is at y = 1? Wait, no, the y - axis has 0, 2, -2, etc. Wait, the open circle is at ( - 3,1)? Wait, no, the x - coordinate: let's see, the x - axis: the open circle is at x=-3 (since between -4 and -2, the open circle is at x=-3). So the domain is all x - values less than -3? Wait, no, wait: the graph is a curve that starts at the open circle (x=-3, not included) and goes to the left (so x can be any value less than -3? Wait, no, when the arrow is pointing left, that means as x approaches negative infinity, the graph is defined. So the domain is \(x < - 3\)? Wait, no, wait, maybe I made a mistake. Wait, the open circle is at x=-3 (so x=-3 is not included), and the graph extends to the left (so x can be any real number less than -3? Wait, no, that can't be. Wait, maybe the open circle is at x=-3, and the graph includes all x - values less than or equal to -3? No, because it's an open circle, so x=-3 is not included. So the domain is \(x < - 3\)? Wait, no, wait, let's re - examine. The x - coordinate of the open circle: let's look at the x - axis. The open circle is at x=-3 (since the x - axis has grid lines, and the open circle is at x=-3). The graph is a curve that starts at x=-3 (not included) and goes to the left (so x can be any value less than -3? Wait, no, when the arrow is pointing left, that means for all x less than -3, the graph is defined. So the domain is \(x < - 3\)? Wait, no, maybe I got the direction wrong. Wait, the arrow is on the left end of the curve, so as x decreases (becomes more negative), the curve continues. So the domain is all real numbers x such that \(x \leq - 3\)? No, because the point at x=-3 is an open circle, so it's not included. So the domain is \(x < - 3\)? Wait, no, wait, let's check the x - value of the open circle again. Let's count the grid squares: from x=-4 to x=-2 is 2 units, so each grid square is 1 unit. The open circle is at x=-3 (between -4 and -2, 1 unit from -4, 1 unit from -2). So the x - coordinate of the open circle is -3. The graph is a curve that starts at x=-3 (open circle, so not included) and extends to the left (so x can be any value less than -3). So the domain is \(x < - 3\)? Wait, no, that seems off. Wait, maybe the open circle is at x=-3, and the domain is all x such that \(x \leq - 3\)? No, open circle means the point is not included. So the domain is \(x < - 3\)? Wait, no, let's think again. The domain of a function is the set of all x - values for which the function is defined. The graph has an open circle at x=-3, which means x=-3 is not in the domain, and the graph extends to the left (so for all x less than -3, the graph is defined). So the domain inequality is \(x < - 3\)? Wait, no, maybe I made a mistake in the x - coordinate of the open circle. Wait, looking at the x - axis: the labels are -6, -4, -2, 0, 2, 4, 6. So the distance between -6 and -4 is 2 units, so each grid square is 1 unit. So the open circle is at x=-3 (since it's halfway between -4 and -2? No, -4, -3, -2: so the open circle is at x=-3. So the domain is all x such that \(x < - 3\)? Wait, no, when the arrow is pointing left, that means as x decreases (goes to negative infinity), the graph is still there. So the domain is \(x \leq - 3\)? No, open circle means x=-3 is not included. So \(x < - 3\).
Step2: Determine the range
The range is the set of all y - values. Looking at the graph, the curve goes from the open circle (y - coordinate of the open circle: let's see, the open circle is at y = 1? Wait, no, the y - axis: the open circle is at y = 1? Wait, the y - axis has 0, 2, -2, -4, -6. The open circle is at y = 1? Wait, no, the y - coordinate of the open circle: looking at the graph, the open circle is at ( - 3,1)? Wait, no, the y - value: the horizontal line (x - axis) is y = 0. The open circle is above the x - axis, at y = 1? Wait, no, the y - axis grid lines: each grid square is 1 unit. So the open circle is at y = 1? Wait, no, the graph is a curve that goes downwards. Wait, the range: the lowest point? Wait, the graph has a curve that goes from the open circle (y - value of the open circle) and extends downwards (since the curve goes towards lower y - values). Wait, the open circle is at y = 1 (not included, since it's an open circle) and the curve goes downwards, so the y - values can be any real number less than 1? Wait, no, wait: the range is the set of all y - values. The graph starts at the open circle (y = 1, not included) and goes down (so y can be any real number less than 1? Wait, no, let's see the graph. The curve is a parabola - like shape? Wait, no, it's a curve that starts at ( - 3,1) (open circle) and goes downwards, with the arrow pointing left, but for the range, we look at the y - values. The graph extends downwards, so the y - values can be any real number less than or equal to... Wait, no, the open circle is at y = 1 (not included), and the curve goes down, so the range is all real numbers y such that \(y < \infty\)? No, that can't be. Wait, no, looking at the graph, the curve goes from the open circle (y - coordinate of the open circle: let's check the y - axis. The open circle is at y = 1? Wait, no, the y - axis: the open circle is at y = 1? Wait, the x - axis is y = 0, so the open circle is at y = 1 (above the x - axis), and the curve goes downwards, so the y - values start from less than 1 (since the open circle is at y = 1, not included) and go to negative infinity? Wait, no, the curve is going down, so as x decreases, y decreases? Wait, no, the graph is a curve that, as x decreases (moves left), what happens to y? The curve goes from the open circle (y = 1) downwards, so y can be any real number less than 1? Wait, no, that doesn't make sense. Wait, maybe the open circle is at y = 1 (not included) and the range is all real numbers y such that \(y \leq \infty\)? No, that's not right. Wait, no, let's re - examine. The range: the set of all y - values. The graph has a curve that starts at the open circle (y = 1, not included) and extends downwards, so the y - values can be any real number less than 1? Wait, no, the curve is going towards lower y - values, so the range is \(y < \infty\)? No, that's not correct. Wait, maybe I made a mistake. Wait, the open circle is at ( - 3,1) (open circle, so ( - 3,1) is not included), and the curve goes down, so the range is all real numbers y such that \(y < 1\)? Wait, no, the curve is a function? Wait, no, it's a relation, but the range is the set of y - values. Wait, the graph: the lowest point? Wait, the curve goes down, so y can be any real number less than 1? Wait, no, let's think again. The open circle is at y = 1 (not included), and the curve goes down, so the range is \(y < \infty\)? No, that's not possible. Wait, maybe the open circle is at y = 1 (not included) and the range is all real numbers y such that \(y \leq 1\)? No, open circle means y = 1 is not included. So \(y < 1\). Wait, but the curve goes down, so y can be any real number less than 1?
Wait, maybe I made a mistake in the domain. Let's re - check the domain. The open circle is at x=-3 (not included), and the graph extends to the left (so x can be any real number less than -3? Wait, no, when the arrow is pointing left, that means as x approaches negative infinity, the graph is still present. So the domain is \(x < - 3\).
For the range: the open circle is at y = 1 (not included), and the graph goes down, so the y - values can be any real number less than 1? Wait, no, the curve is a parabola opening to the left? Wait, no, it's a curve that is a function of x? Wait, no, it's a relation where for each x (less than -3), there is a y. The range: the y - values start from the open circle (y = 1, not included) and go down, so the range is \(y < \infty\)? No, that's not right. Wait, maybe the open circle is at y = 1 (not included) and the range is all real numbers y such that \(y \leq 1\)? No, open circle means y = 1 is not included. So \(y < 1\).
Wait, maybe I made a mistake in the x - coordinate of the open circle. Let's re - look at the x - axis. The open circle is at x=-3? Wait, the x - axis labels are -6, -4, -2, 0, 2, 4, 6. So the distance between -4 and -2 is 2 units, so each grid square is 1 unit. So the open circle is at x=-3 (between -4 and -2). So the domain is \(x < - 3\).
For the range: the open circle is at y = 1 (not included), and the graph goes down, so the range is \(y < 1\)? Wait, no, the curve is a parabola that opens to the left, so its range would be all real numbers? Wait, no, maybe the open circle is at ( - 3,1) and the curve is a parabola with vertex at ( - 3,1), opening to the left. So the range of a parabola opening to the left is all real numbers (since it extends up and down). Wait, that makes more sense! Oh, I see, I made a mistake earlier. The curve is a parabola opening to the left, with vertex at ( - 3,1) (open circle, so not included). So the range (y - values) can be any real number, because the parabola opens to the left, so it extends infinitely up and down. Wait, that's a key mistake. So the range is all real numbers, so \(y \in (-\infty, \infty)\), but as an inequality, we can write \(y\) is any real number, but the problem says "write the range as an inequality". Wait, no, let's re - examine the graph. The curve is a parabola opening to the left, with vertex at ( - 3,1) (open circle). So the parabola opens to the left, so for a parabola \(x = a(y - k)^2+h\) (opening left, \(a < 0\)), the range is all real numbers (since y can be any real number). So the range is \(y\) is any real number, so in inequality terms, \(-\infty < y < \infty\), or \(y\) is a real number. But that seems odd. Wait, maybe the open circle is at ( - 3,1) and the parabola opens to the left, so the range is all real numbers, so the inequality for the range is \(y\) can be any real number, so \(-\infty < y < \infty\), but usually, we write it as \(y \in \mathbb{R}\), but as an inequality, we can write \(y\) is any real number, so \(-\infty < y < \infty\). But that contradicts my earlier thought. Wait, let's check the graph again. The curve is a parabola opening to the left, so it goes up and down infinitely, so the range is all real numbers. So the range is \(y\) is any real number, so the inequality is \(-\infty < y < \infty\), or we can write \(y\) is a real number, but in the context of the problem, maybe the range is all real numbers, so the inequality is \(y\) can be any real number, so \(-\infty < y < \infty\).
But let's correct the domain first. The parabola opens to the left, with vertex at ( - 3,1) (open circle). The domain of a parabola opening to the left is \(x \leq h\) (if the vertex is (h,k)), but since it's an open circle, \(x < h\). Here, \(h=-3\), so the domain is \(x < - 3\).
The range of a parabola opening to the left is all real numbers (since y can be any real number), so the range is \(y\) is any real number, so the inequality is \(-\infty < y < \infty\), or we can write \(y\) is a real number, but as an inequality, we can write \(y\) has no restrictions, so \(-\infty < y < \infty\).
Wait, but maybe I made a mistake in the vertex. Let's re - look at the graph. The open circle is at ( - 3,1), and the curve goes down and to the left, and up and to the left? Wait, no, the graph as drawn: the curve starts at the open circle and goes downwards, but if it's a parabola opening to the left, it should g…