QUESTION IMAGE
Question
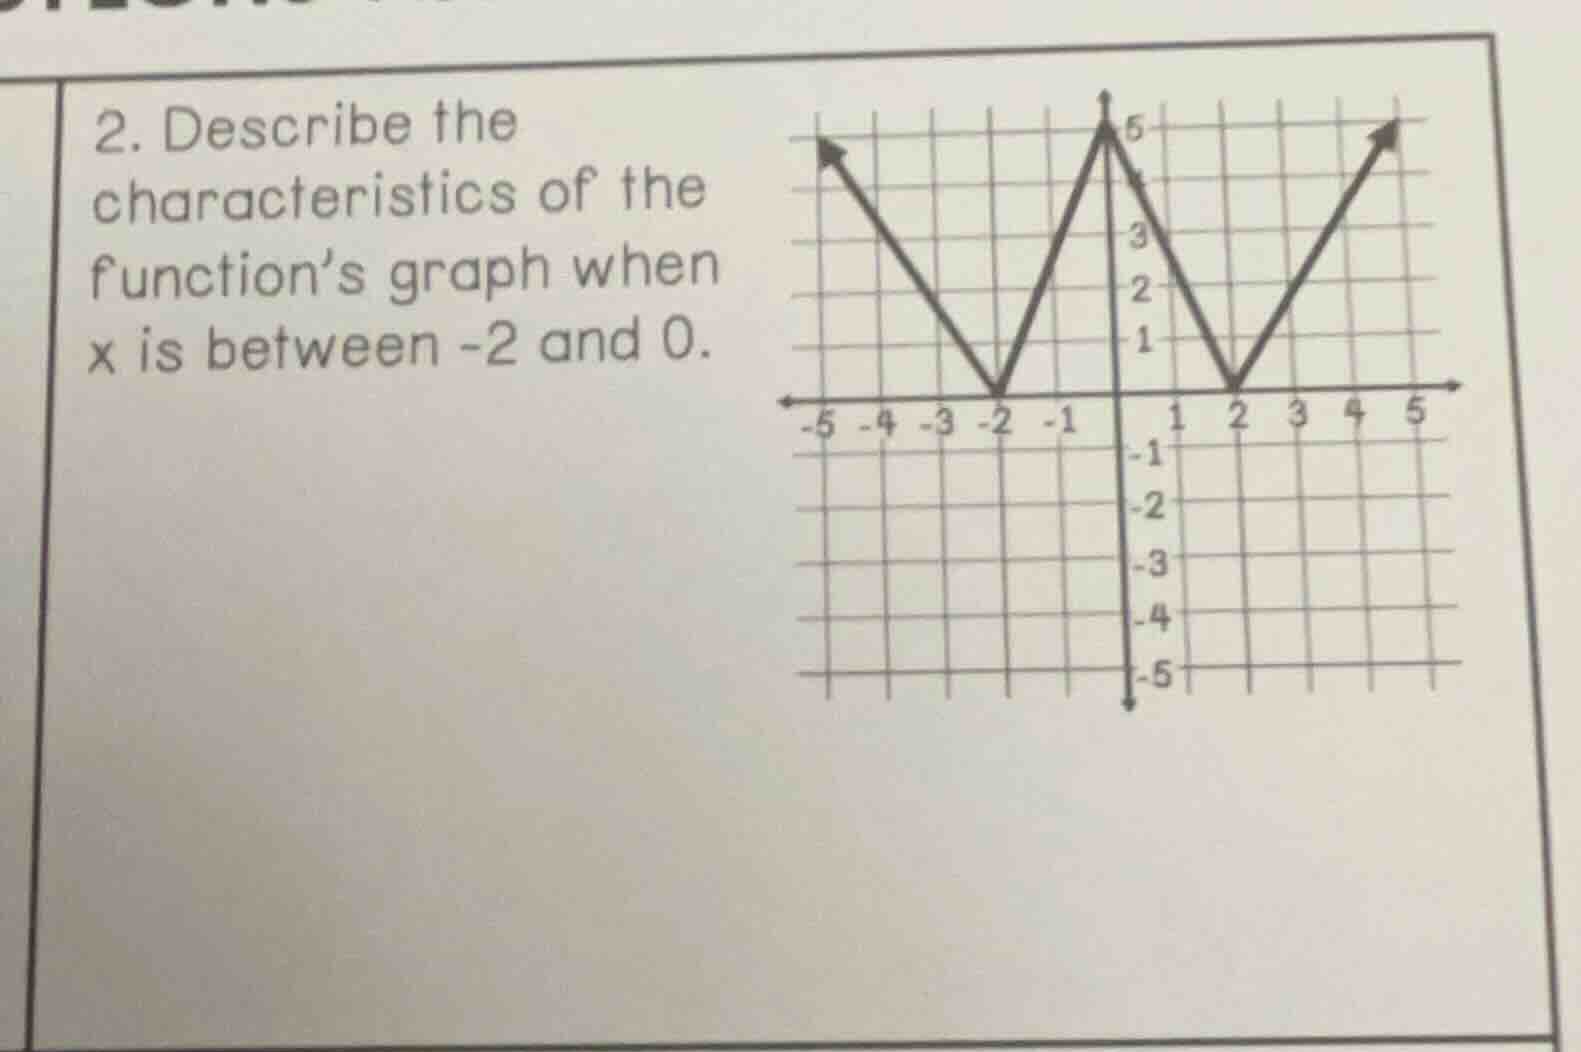
- describe the characteristics of the functions graph when x is between -2 and 0.
Brief Explanations
First, identify the interval $-2 < x < 0$ on the graph. The segment starts at the point $(-2, 0)$ and ends at $(0, 5)$. As the $x$-values increase from -2 to 0, the corresponding $y$-values increase from 0 to 5. This means the graph moves upward from left to right in this interval, and it is a straight line segment (linear) with a positive slope.

Snap & solve any problem in the app
Get step-by-step solutions on Sovi AI
Photo-based solutions with guided steps
Explore more problems and detailed explanations
When $x$ is between -2 and 0, the graph is a straight, increasing line segment: as $x$ increases from -2 to 0, $y$ increases from 0 to 5, so the function is strictly increasing on this interval, with a positive constant slope.