QUESTION IMAGE
Question
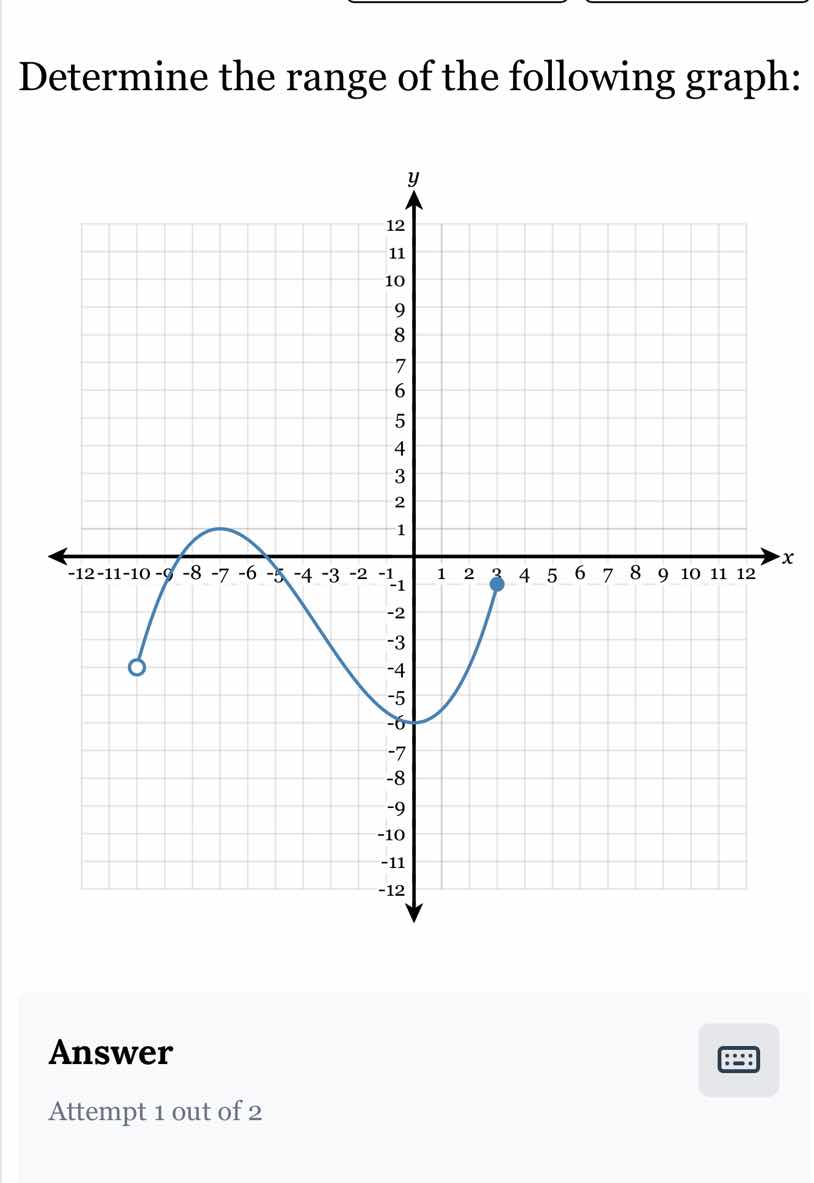
determine the range of the following graph: graph of a function on a coordinate plane answer attempt 1 out of 2
Step1: Identify the lowest and highest y - values
First, we look at the graph. The lowest point on the graph (the minimum y - value) is - 6 (from the part of the graph near the origin) and we also have to consider the other parts. Wait, actually, let's analyze the graph's vertical extent. The graph has a point at (3, - 1) (the filled dot) and the curve goes down to - 6? Wait, no, let's re - examine. The left - most part has an open circle at x=-10, let's find its y - value. The peak of the left - hand curve is at y = 1 (around x=-7), then it goes down. The right - hand part has a filled dot at (3, - 1) and the curve at the bottom (near the y - axis) is at y=-6? Wait, no, let's look at the y - axis. The grid lines: each square is 1 unit. Let's find the minimum and maximum y - values.
The maximum y - value on the graph: the left - hand curve has a peak at y = 1 (since it's above the x - axis, around x=-7). The minimum y - value: looking at the graph, the lowest point is at y=-6? Wait, no, the right - hand curve has a filled dot at (3, - 1) and the curve near the y - axis (the bottom of the right - hand curve) is at y=-6? Wait, no, let's check the coordinates. Wait, the open circle is at x = - 10, what's its y - value? From the graph, the open circle is at ( - 10, - 4)? Wait, no, the left - hand curve: starts at open circle (x=-10, y=-4? Wait, no, the y - axis: the open circle is at x=-10, and looking at the y - coordinate, it's at y=-4? Wait, maybe I made a mistake. Let's do it properly.
Range is the set of all possible y - values of the function. So we need to find the minimum and maximum y - values that the graph covers.
Looking at the graph:
- The highest point (maximum y - value): the left - hand curve has a peak at y = 1 (because it's above the x - axis, and the y - coordinate there is 1).
- The lowest point (minimum y - value): the graph goes down to y=-6? Wait, no, the right - hand curve has a filled dot at (3, - 1) and the curve near the origin (the bottom of the right - hand curve) is at y=-6? Wait, no, let's check the y - axis. The point at the bottom (near the y - axis) is at (0, - 6)? Wait, the graph at the bottom (the trough) is at y=-6, and the filled dot is at (3, - 1). The left - hand curve: starts at open circle (x=-10, y=-4) (open circle, so not included), then goes up to y = 1 (peak), then down. The right - hand curve: starts from the trough (y=-6) and goes up to the filled dot at (3, - 1). Wait, no, the filled dot is at (3, - 1), so the y - value there is - 1. Wait, maybe I misread. Let's look again:
The left - hand part: open circle at ( - 10, - 4) (so y=-4 is not included), then the curve rises to a peak at y = 1 (around x=-7), then falls. The right - hand part: the curve goes down to y=-6 (at x = 0, maybe) and then rises to the filled dot at (3, - 1) (y=-1). Wait, no, the filled dot is at (3, - 1), so the y - value is - 1. Wait, this is confusing. Let's use the standard method:
- Find the maximum y - coordinate: The left - hand curve has a peak at y = 1 (since it's above the x - axis, and that's the highest point on the graph).
- Find the minimum y - coordinate: The graph goes down to y=-6 (the lowest point on the graph, as seen from the curve near the y - axis). But wait, the filled dot is at (3, - 1), and the open circle is at ( - 10, - 4) (not included). Wait, no, let's check the y - values:
- The open circle is at ( - 10, - 4), so y=-4 is not in the range.
- The peak of the left - hand curve is at y = 1 (included, since the curve passes through there).
- The lowest point of the graph (the mini…

Snap & solve any problem in the app
Get step-by-step solutions on Sovi AI
Photo-based solutions with guided steps
Explore more problems and detailed explanations
The range of the graph is \(-6\leq y\leq1\)