QUESTION IMAGE
Question
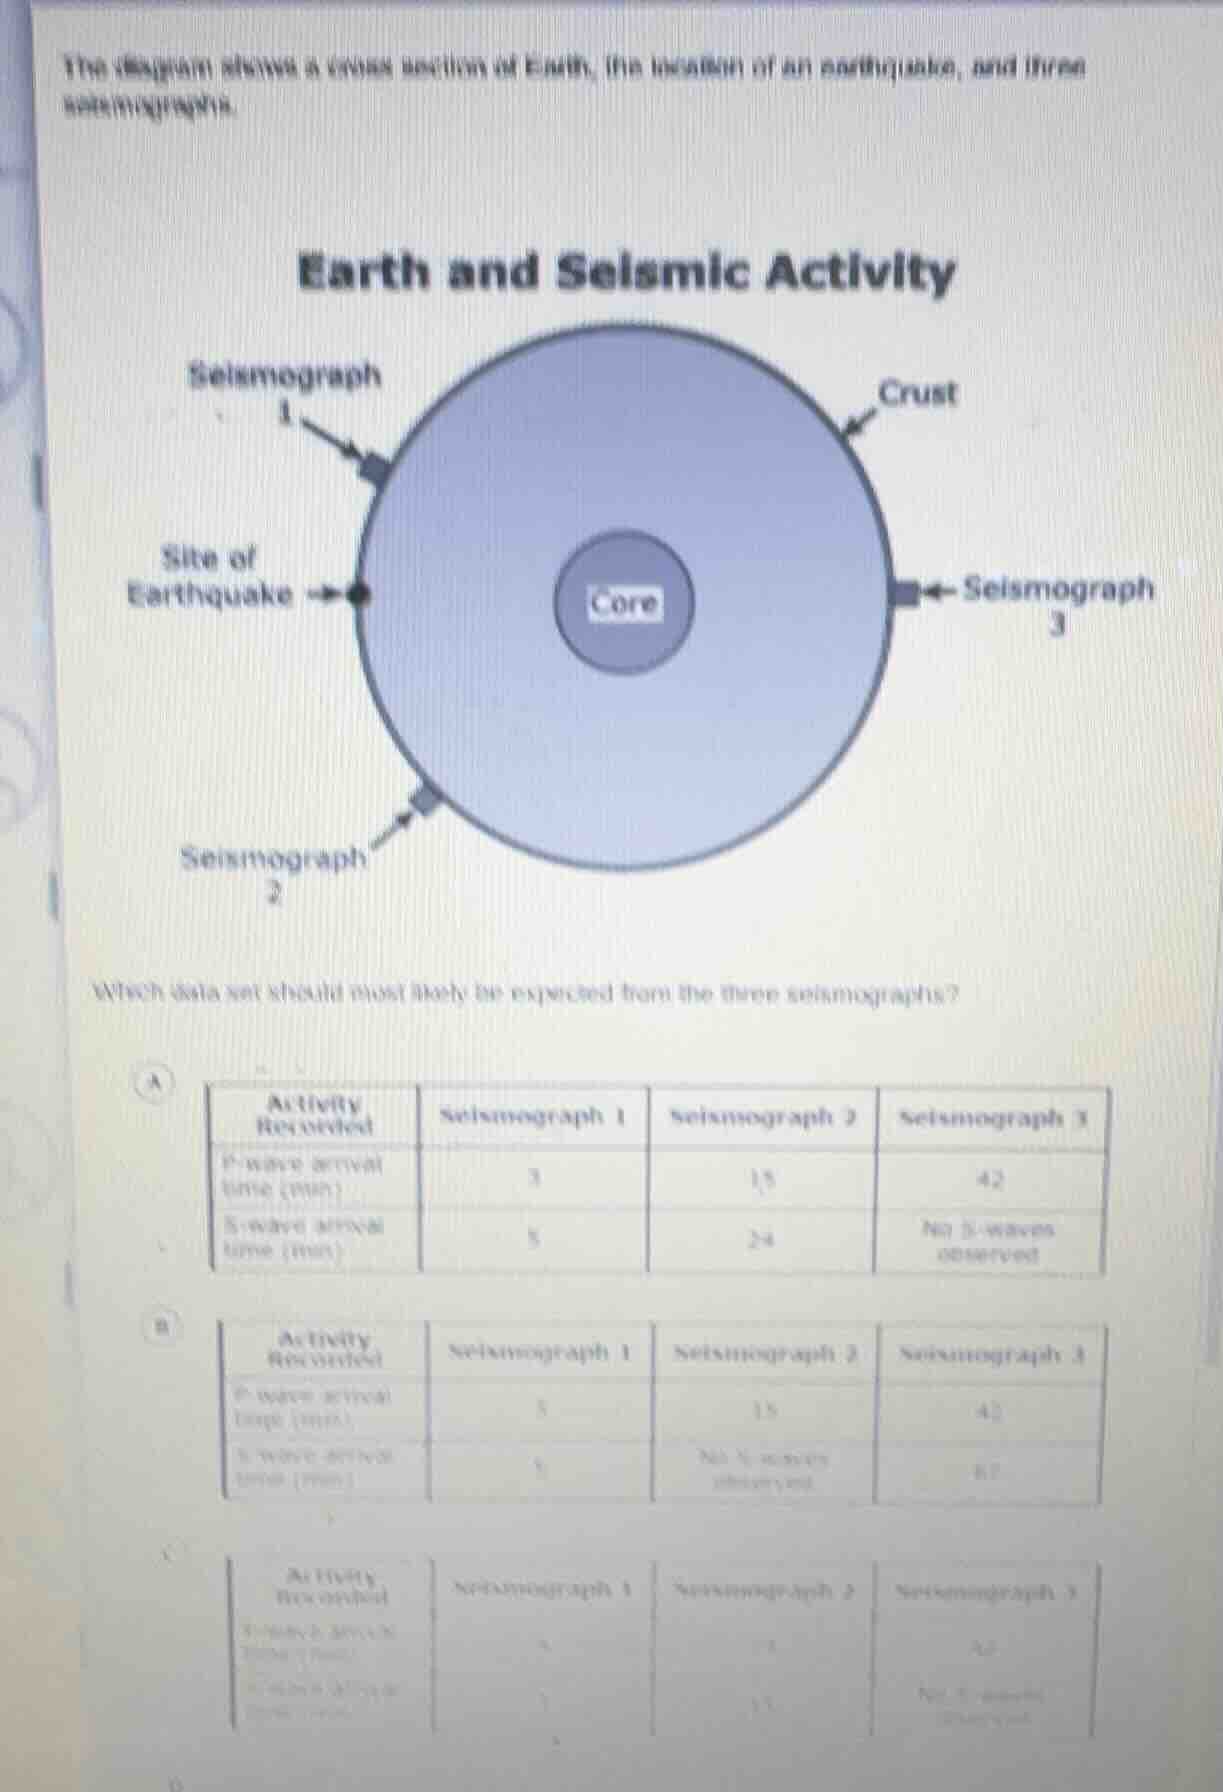
the diagram shows a cross section of earth, the location of an earthquake, and three seismographs.earth and seismic activitywhich data set should most likely be expected from the three seismographs?a| activity recorded | seismograph 1 | seismograph 2 | seismograph 3 || ---- | ---- | ---- | ---- || p-wave arrival time (min) | 3 | 15 | 42 || s-wave arrival time (min) | 5 | 24 | no s-waves observed |b| activity recorded | seismograph 1 | seismograph 2 | seismograph 3 || ---- | ---- | ---- | ---- || p-wave arrival time (min) | 3 | 15 | 42 || s-wave arrival time (min) | 5 | no s-waves observed | 67 |c| activity recorded | seismograph 1 | seismograph 2 | seismograph 3 || ---- | ---- | ---- | ---- || p-wave arrival time (min) | 3 | 15 | 42 || s-wave arrival time (min) | 5 | 17 | no s-waves observed |
- Seismograph 1 is closest to the earthquake, so it will have the earliest P-wave and S-wave arrival times, with a small time gap between them.
- Seismograph 2 is farther away, so its P-wave and S-wave arrival times will be later than Seismograph 1, with a larger gap between the two.
- Seismograph 3 is on the opposite side of the Earth from the earthquake, placing it in the S-wave shadow zone. S-waves cannot travel through the liquid outer core, so this seismograph will not detect any S-waves, and its P-wave arrival time will be the latest of the three.

Snap & solve any problem in the app
Get step-by-step solutions on Sovi AI
Photo-based solutions with guided steps
Explore more problems and detailed explanations
A.
| Activity Recorded | Seismograph 1 | Seismograph 2 | Seismograph 3 |
|---|---|---|---|
| S-wave arrival time (min) | 5 | 24 | No S-waves observed |