QUESTION IMAGE
Question
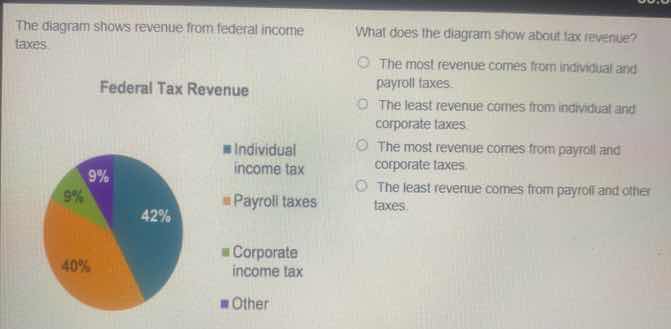
the diagram shows revenue from federal income taxes.
federal tax revenue
■individual income tax
■payroll taxes
■corporate income tax
■other
what does the diagram show about tax revenue?
○ the most revenue comes from individual and payroll taxes.
○ the least revenue comes from individual and corporate taxes.
○ the most revenue comes from payroll and corporate taxes.
○ the least revenue comes from payroll and other taxes.
First, analyze the percentages from the pie chart: Individual income tax is 42%, Payroll taxes are 40%, Corporate income tax is 9%, and Other is 9%. Compare the values to identify the largest and smallest revenue sources. The two largest categories are individual income tax (42%) and payroll taxes (40%), which together make up the majority of federal tax revenue.

Snap & solve any problem in the app
Get step-by-step solutions on Sovi AI
Photo-based solutions with guided steps
Explore more problems and detailed explanations
A. The most revenue comes from individual and payroll taxes.