QUESTION IMAGE
Question
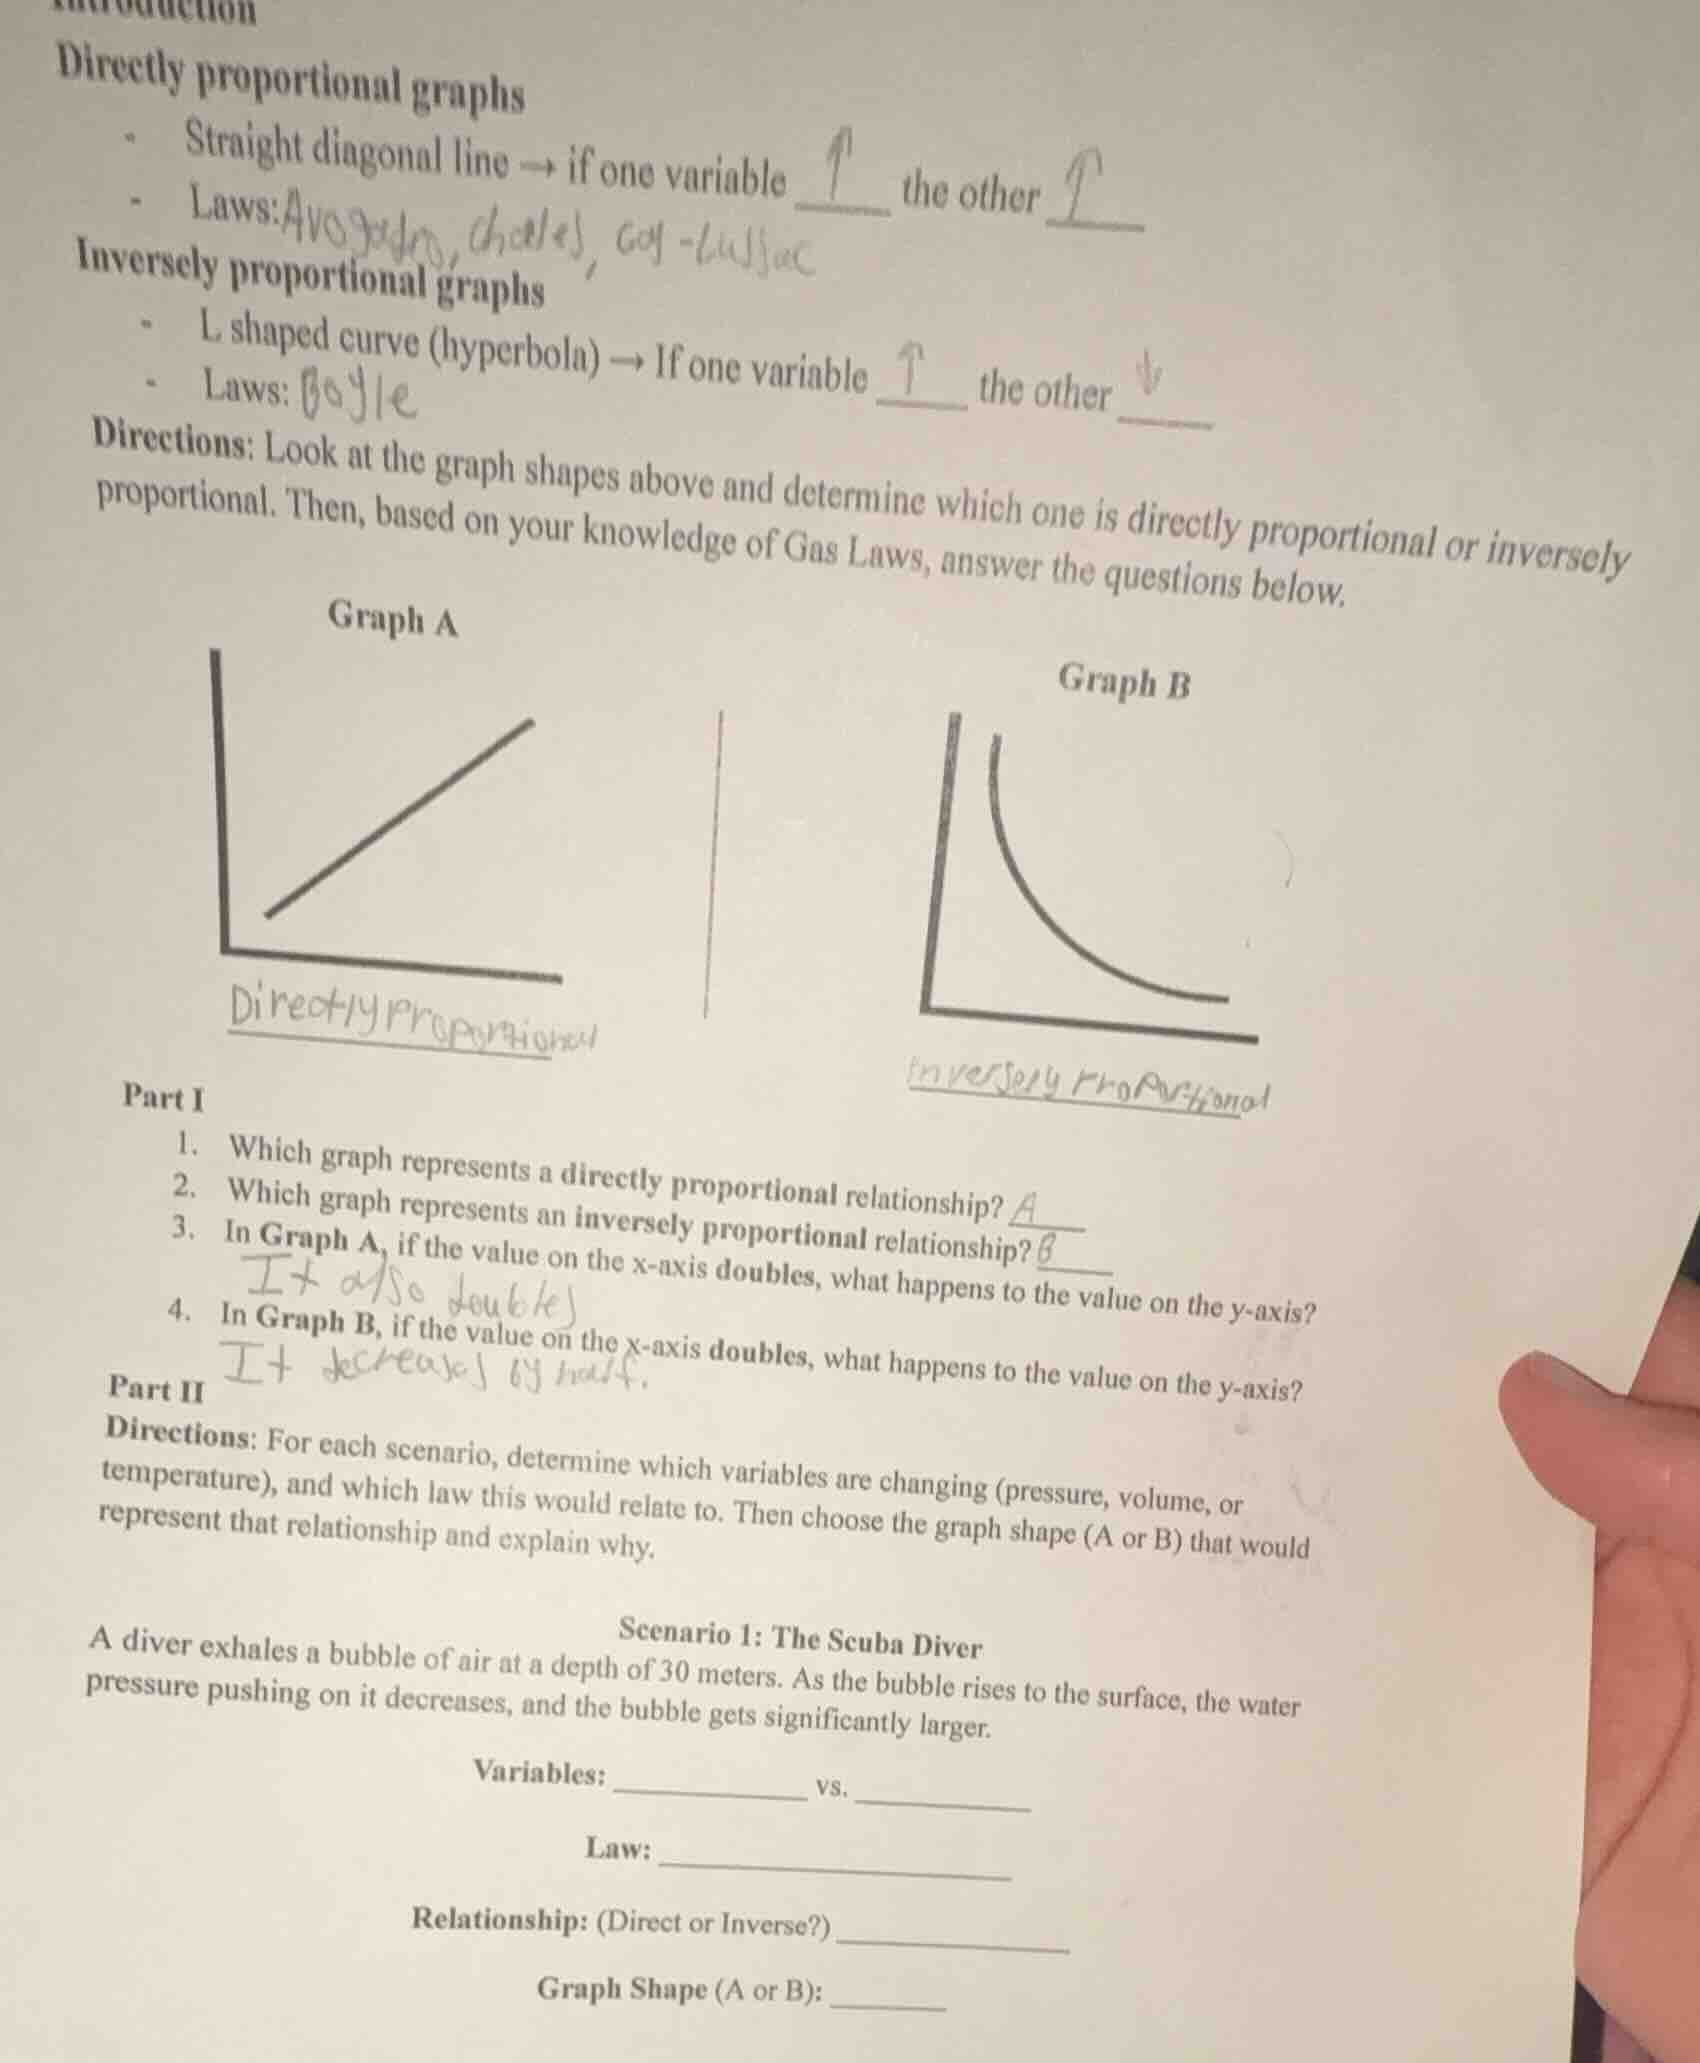
directly proportional graphs- straight diagonal line → if one variable ↑ the other ↑- laws: avogadro, charles, gay-lussacinversely proportional graphs- l shaped curve (hyperbola) → if one variable ↑ the other ↓- laws: boyledirections: look at the graph shapes above and determine which one is directly proportional or inversely proportional. then, based on your knowledge of gas laws, answer the questions below.graph agraph bpart i1. which graph represents a directly proportional relationship?2. which graph represents an inversely proportional relationship?3. in graph a, if the value on the x-axis doubles, what happens to the value on the y-axis?4. in graph b, if the value on the x-axis doubles, what happens to the value on the y-axis?part iidirections: for each scenario, determine which variables are changing (pressure, volume, or temperature), and which law this would relate to. then choose the graph shape (a or b) that would represent that relationship and explain why.scenario 1: the scuba divera diver exhales a bubble of air at a depth of 30 meters. as the bubble rises to the surface, the water pressure pushing on it decreases, and the bubble gets significantly larger.variables: ________ vs. ______law: ________________relationship: (direct or inverse?) ___________graph shape (a or b): _____
Step1: Answer Part I questions
- Direct proportional graphs are straight diagonal lines (Graph A).
- Inverse proportional graphs are hyperbolas (Graph B).
- Direct proportionality: $y \propto x$, so if $x \times 2$, $y \times 2$.
- Inverse proportionality: $y \propto \frac{1}{x}$, so if $x \times 2$, $y \times \frac{1}{2}$.
Step2: Analyze Scenario 1
Identify changing variables: pressure (decreases) and volume (increases). This matches Boyle's Law: $P \propto \frac{1}{V}$ (constant temperature), which is inverse proportionality, corresponding to Graph B.

Snap & solve any problem in the app
Get step-by-step solutions on Sovi AI
Photo-based solutions with guided steps
Explore more problems and detailed explanations
Part I
- Graph A
- Graph B
- The value on the y-axis doubles.
- The value on the y-axis is reduced by half (becomes 1/2 of its original value).
Part II
Variables: Pressure vs. Volume
Law: Boyle's Law
Relationship: Inverse
Graph Shape (A or B): B