QUESTION IMAGE
Question
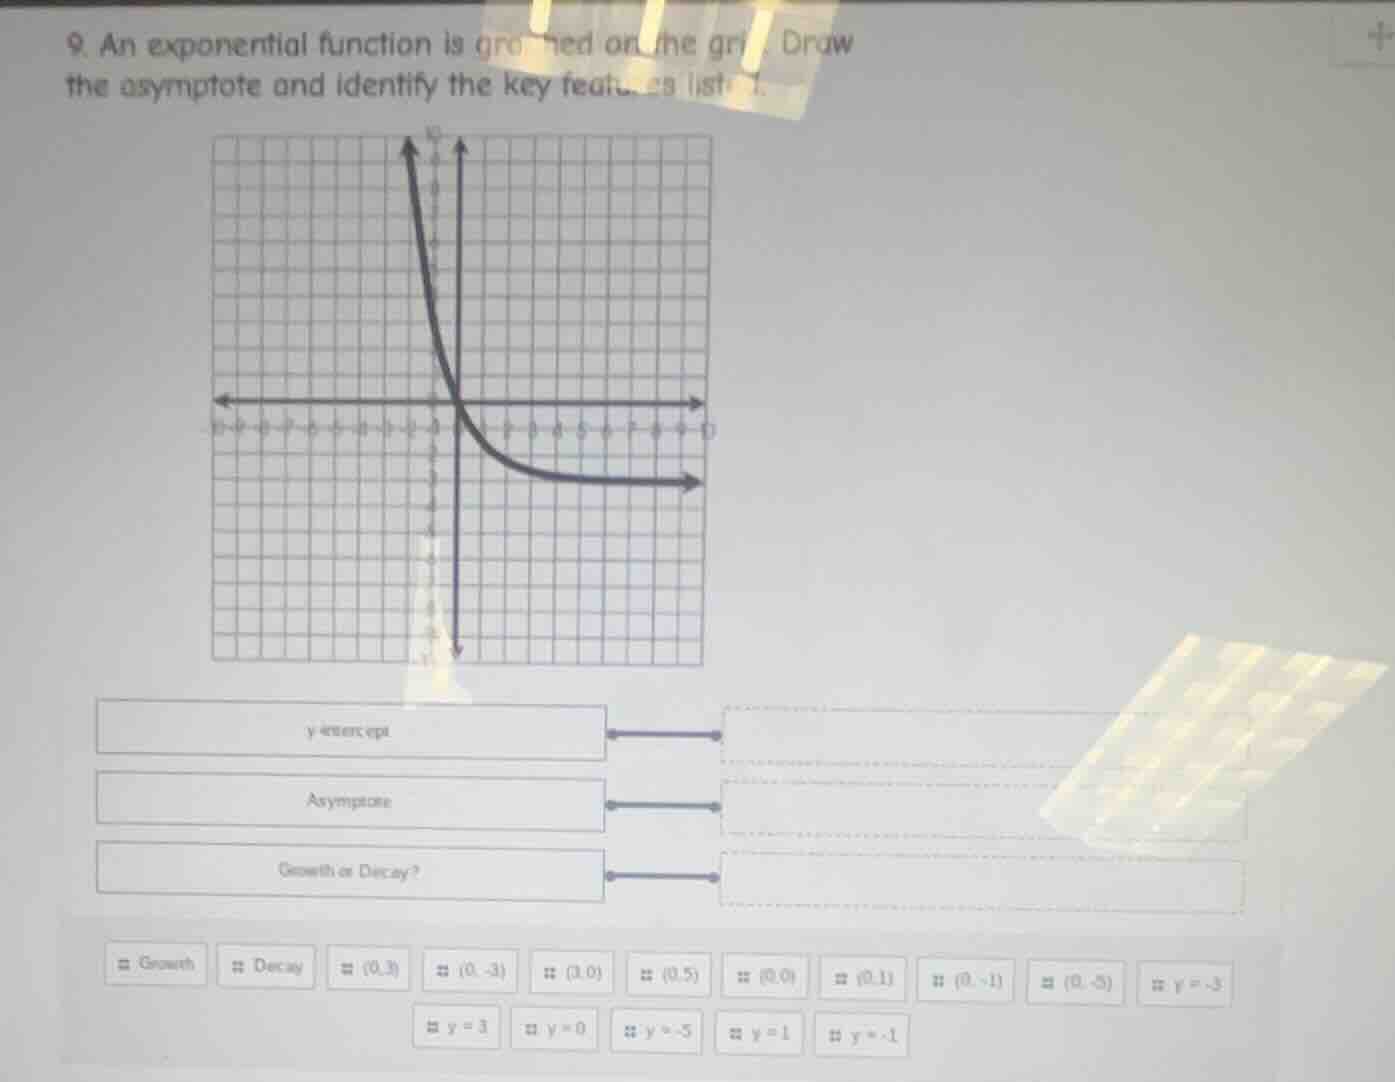
- an exponential function is graphed on the grid. draw the asymptote and identify the key features listed. y - intercept asymptote growth or decay? growth decay (0,3) (0, -3) (3,0) (0,5) (0,0) (0,1) (0, -1) (0, -5) y = -5 y = 3 y = 0 y = -5 y = 1 y = -1
Step1: Identify y-intercept
The graph crosses the y-axis at $(0,1)$.
Step2: Identify horizontal asymptote
The graph approaches $y=0$ as $x\to\infty$.
Step3: Determine growth/decay
The graph decreases as $x$ increases, so it is decay.

Snap & solve any problem in the app
Get step-by-step solutions on Sovi AI
Photo-based solutions with guided steps
Explore more problems and detailed explanations
- y-intercept: $(0,1)$
- Asymptote: $y=0$
- Growth or Decay? Decay