QUESTION IMAGE
Question
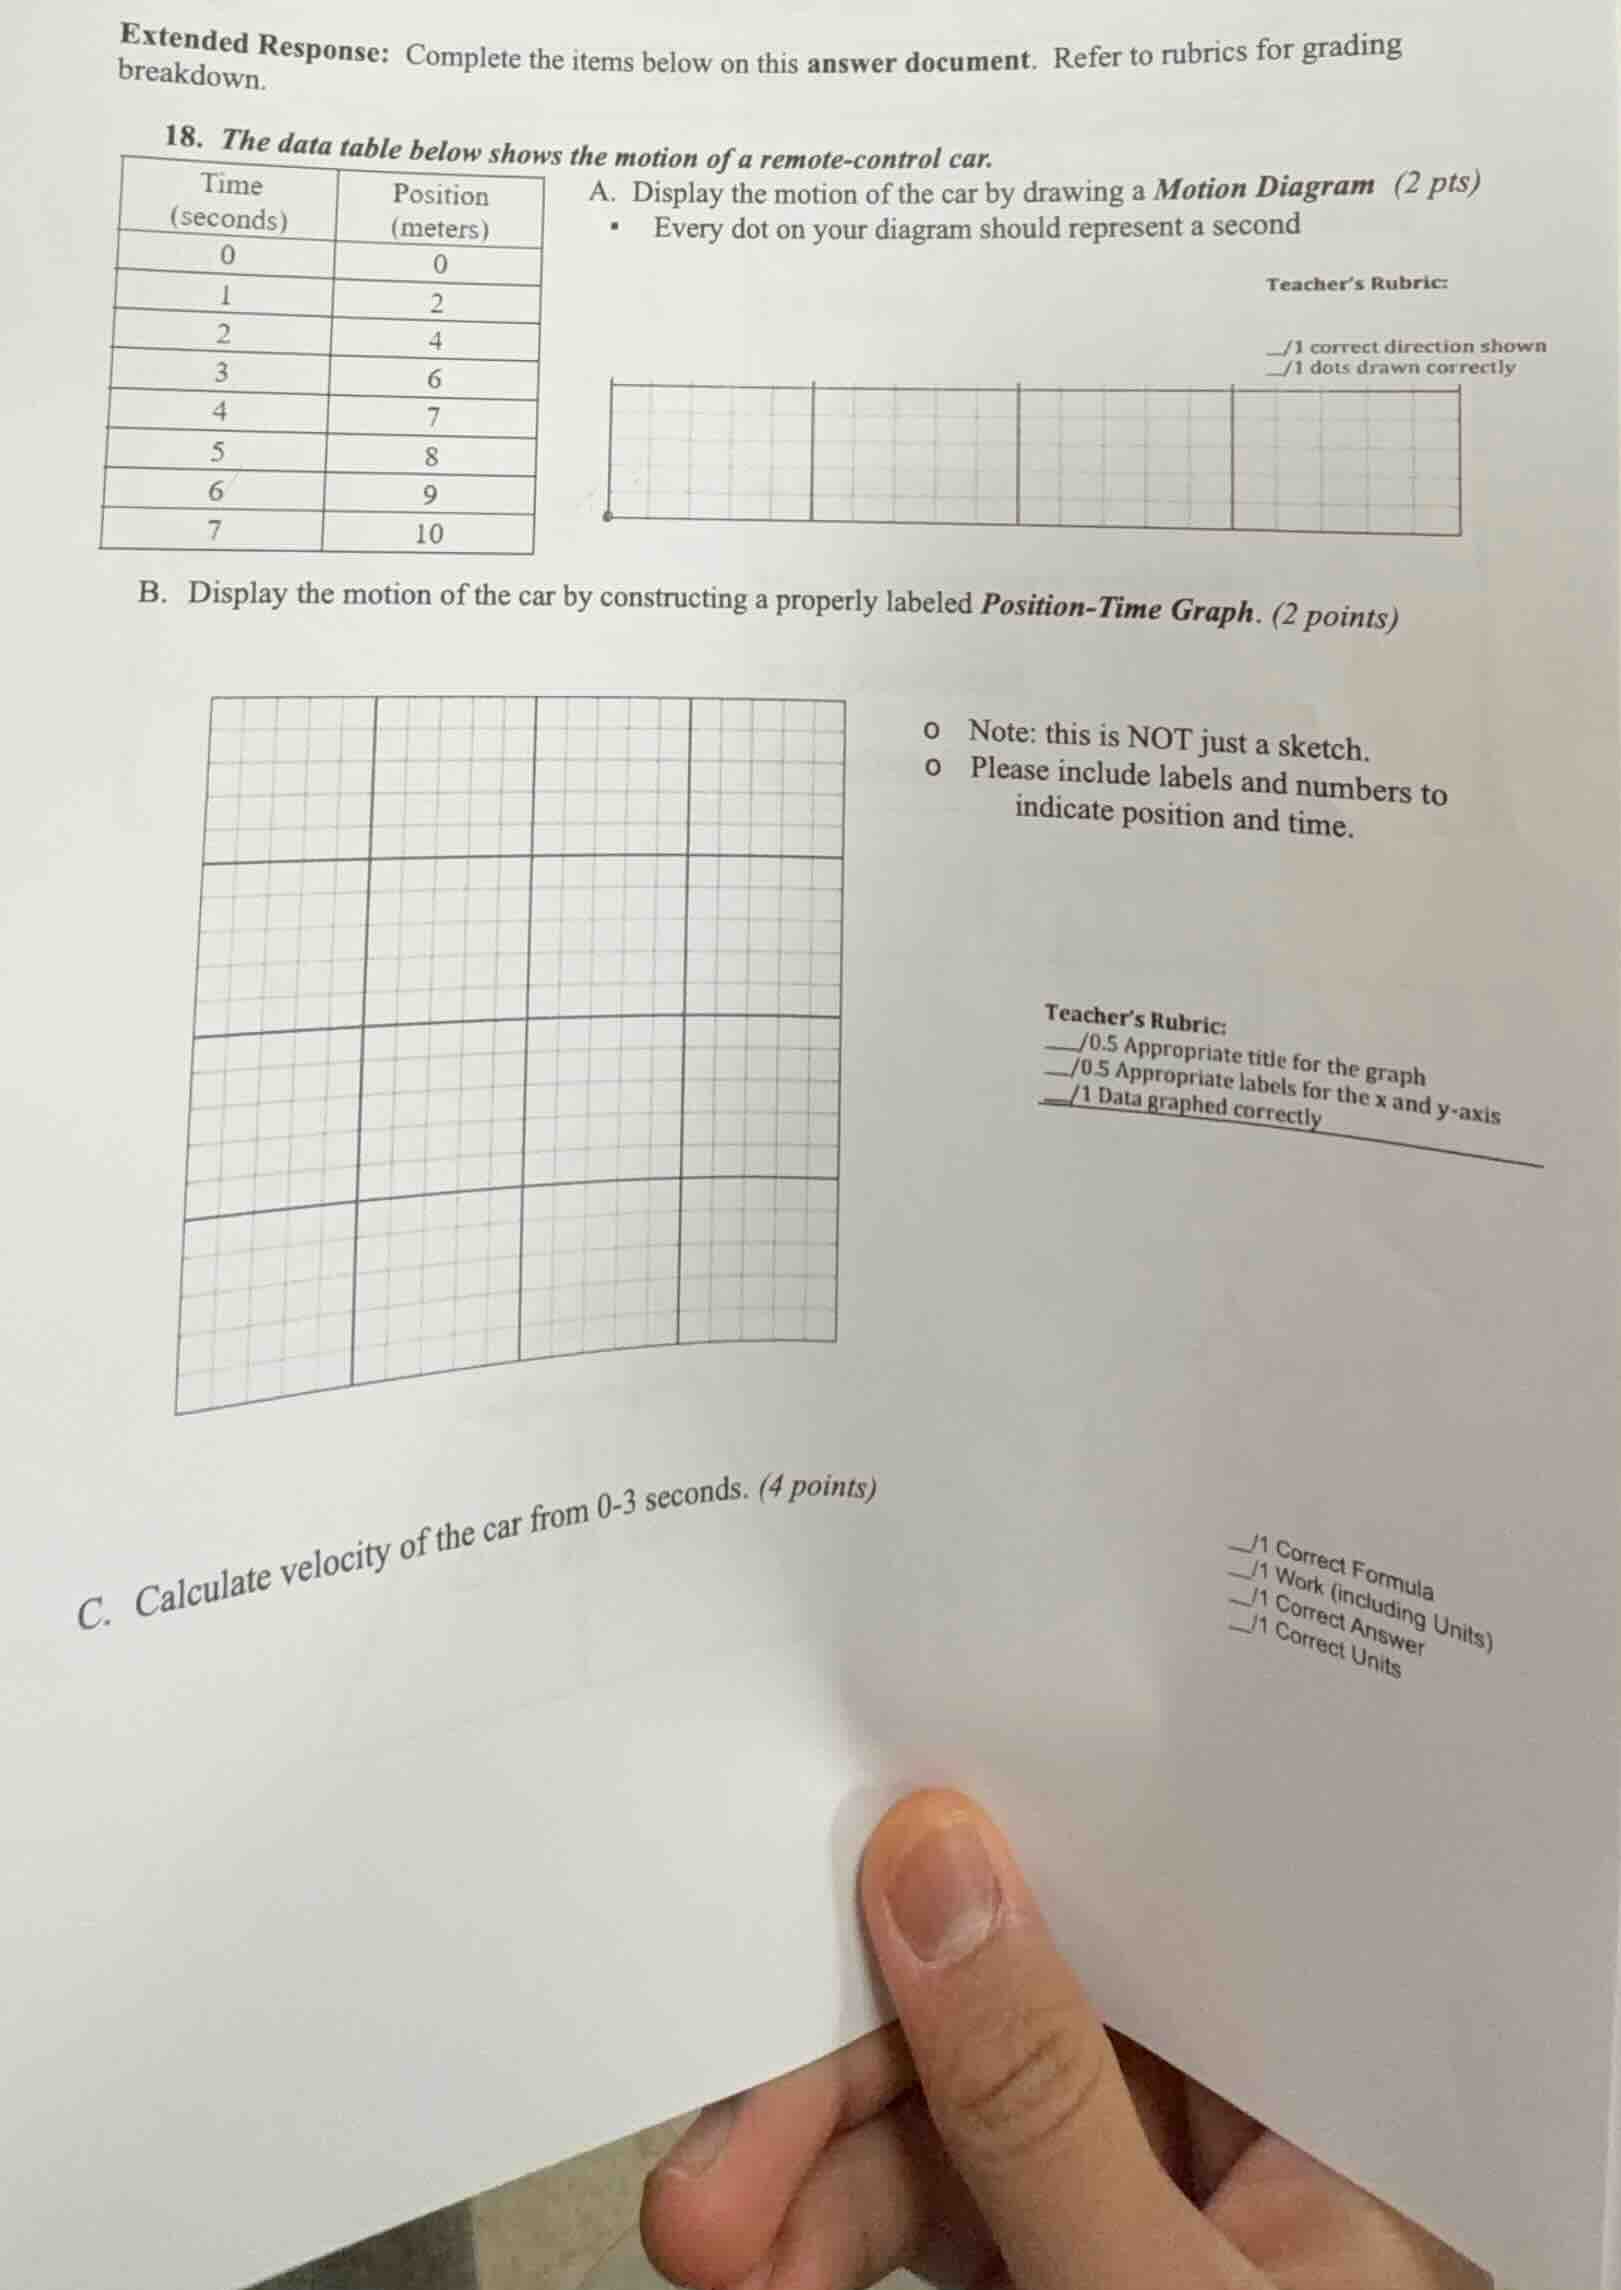
extended response: complete the items below on this answer document. refer to rubrics for grading breakdown.
- the data table below shows the motion of a remote - control car.
a. display the motion of the car by drawing a motion diagram (2 pts)
- every dot on your diagram should represent a second
teacher’s rubric:
- /1 correct direction shown
- /1 dots drawn correctly
b. display the motion of the car by constructing a properly labeled position - time graph. (2 points)
- note: this is not just a sketch.
- please include labels and numbers to indicate position and time.
teacher’s rubric:
- /0.5 appropriate title for the graph
- /0.5 appropriate labels for the x and y - axis
- /1 data graphed correctly
c. calculate velocity of the car from 0 - 3 seconds. (4 points)
- /1 correct formula
- /1 work (including units)
- /1 correct answer
- /1 correct units
Part A: Motion Diagram
Step1: Understand Motion Diagram
A motion diagram uses dots to represent the position of an object at equal time intervals. Here, each dot represents 1 second. The car's position increases with time, so the dots should be spaced to show the position at each second (0,1,2,3,4,5,6,7 seconds) with positions 0,2,4,6,7,8,9,10 meters respectively. The direction is consistent (assuming positive direction as increasing position), so dots are drawn in a straight line (or along a path) with spacing corresponding to position. For 0 - 3 seconds, the position increases by 2 m each second (uniform motion), then from 3 - 4 seconds, it increases by 1 m, then 1 m each subsequent second. But the motion diagram just needs dots at each time (second) with correct position. So we place dots at positions: at time 0 (position 0), time 1 (position 2), time 2 (position 4), time 3 (position 6), time 4 (position 7), time 5 (position 8), time 6 (position 9), time 7 (position 10). The direction is shown by the order of dots (from left to right or along a line with increasing position).
Step2: Draw the Motion Diagram
- Draw a horizontal line (to represent the path of the car).
- Place a dot at the start (time 0, position 0).
- Then, at 2 meters from the first dot (time 1), place the next dot.
- At 4 meters from the start (time 2), next dot.
- At 6 meters (time 3), next dot.
- Then, at 7 meters (time 4), 8 meters (time 5), 9 meters (time 6), 10 meters (time 7). The spacing between 0 - 3 seconds is 2 m per dot, then 1 m per dot after that. The direction is indicated by the sequence of dots (from left to right, showing motion in the positive direction).
Part B: Position - Time Graph
Step1: Set Up Axes
- X - axis (Independent Variable): Time (in seconds). Label it "Time (s)". Mark the x - axis with values 0,1,2,3,4,5,6,7.
- Y - axis (Dependent Variable): Position (in meters). Label it "Position (m)". Mark the y - axis with values 0,2,4,6,7,8,9,10 (or a suitable scale, e.g., each grid square can represent 1 m on y - axis and 1 s on x - axis).
Step2: Plot Data Points
- For each time - position pair:
- (0,0): plot at (0,0) on the graph.
- (1,2): plot at (1,2).
- (2,4): plot at (2,4).
- (3,6): plot at (3,6).
- (4,7): plot at (4,7).
- (5,8): plot at (5,8).
- (6,9): plot at (6,9).
- (7,10): plot at (7,10).
Step3: Draw the Graph
- Title the graph: "Position - Time Graph of Remote - Control Car".
- Connect the points (though it's a position - time graph, we can connect them with line segments to show the motion). From (0,0) to (3,6), it's a straight line (slope = 2 m/s), then from (3,6) to (4,7) (slope = 1 m/s), then (4,7) to (7,10) (slope = 1 m/s).
Part C: Calculate Velocity from 0 - 3 seconds
Step1: Recall Velocity Formula
The formula for average velocity ($v$) is $v=\frac{\Delta x}{\Delta t}$, where $\Delta x$ is the change in position (displacement) and $\Delta t$ is the change in time.
Step2: Identify $\Delta x$ and $\Delta t$
- At $t = 0$ seconds, position $x_0=0$ meters.
- At $t = 3$ seconds, position $x_3 = 6$ meters.
- So, $\Delta x=x_3 - x_0=6 - 0 = 6$ meters.
- $\Delta t=3 - 0 = 3$ seconds.
Step3: Calculate Velocity
Substitute into the formula: $v=\frac{6\space m}{3\space s}=2\space m/s$.

Snap & solve any problem in the app
Get step-by-step solutions on Sovi AI
Photo-based solutions with guided steps
Explore more problems and detailed explanations
(for Part C):
The velocity of the car from 0 - 3 seconds is $\boldsymbol{2\space m/s}$.
(Note: For Parts A and B, the answer involves drawing, but the steps explain how to construct them. For Part C, the calculated velocity is $2\space m/s$.)