QUESTION IMAGE
Question
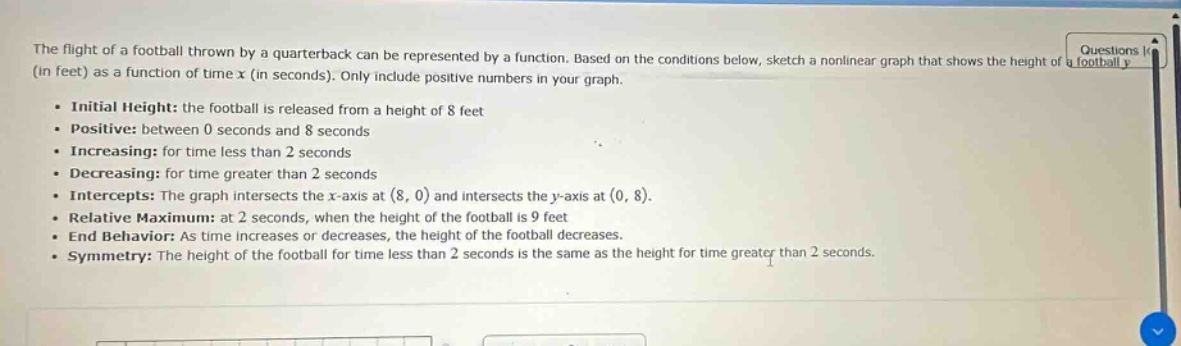
the flight of a football thrown by a quarterback can be represented by a function. based on the conditions below, sketch a nonlinear graph that shows the height of a football y (in feet) as a function of time x (in seconds). only include positive numbers in your graph. - initial height: the football is released from a height of 8 feet - positive: between 0 seconds and 8 seconds - increasing: for time less than 2 seconds - decreasing: for time greater than 2 seconds - intercepts: the graph intersects the x - axis at (8, 0) and intersects the y - axis at (0, 8). - relative maximum: at 2 seconds, when the height of the football is 9 feet - end behavior: as time increases or decreases, the height of the football decreases. - symmetry: the height of the football for time less than 2 seconds is the same as the height for time greater than 2 seconds.
To sketch the graph of the football's height \( y \) (in feet) as a function of time \( x \) (in seconds), we analyze the given conditions:
Step 1: Identify Key Points
- \( y \)-intercept: At \( x = 0 \) (initial time), \( y = 8 \) (point: \( (0, 8) \)).
- Relative Maximum: At \( x = 2 \), \( y = 9 \) (point: \( (2, 9) \)).
- \( x \)-intercept: At \( x = 8 \), \( y = 0 \) (point: \( (8, 0) \)).
Step 2: Analyze Behavior
- Increasing/Decreasing:
- For \( 0 < x < 2 \), the function is increasing (rises from \( (0, 8) \) to \( (2, 9) \)).
- For \( 2 < x < 8 \), the function is decreasing (falls from \( (2, 9) \) to \( (8, 0) \)).
- Symmetry: The graph is symmetric about \( x = 2 \) (height at \( x = 2 - t \) equals height at \( x = 2 + t \)).
- End Behavior: For \( x < 0 \) or \( x > 8 \), \( y \) is not positive (so we only sketch \( 0 \leq x \leq 8 \)).
Step 3: Sketch the Graph
- Plot the points \( (0, 8) \), \( (2, 9) \), and \( (8, 0) \).
- Draw a smooth curve:
- From \( (0, 8) \) to \( (2, 9) \): A curve that rises (increasing).
- From \( (2, 9) \) to \( (8, 0) \): A curve that falls (decreasing), symmetric to the left side.
The graph is a parabola - shaped curve (or a nonlinear curve) opening downward, with vertex at \( (2, 9) \), passing through \( (0, 8) \) and \( (8, 0) \), increasing before \( x = 2 \), and decreasing after \( x = 2 \).
Final Graph Description
- Axes: Label the \( x \)-axis “Time (seconds)” and \( y \)-axis “Height (feet).”
- Plot the key points and draw the curve connecting them, ensuring symmetry about \( x = 2 \).
(Note: For a precise sketch, use graph paper or software to plot the points and draw the symmetric, nonlinear curve.)

Snap & solve any problem in the app
Get step-by-step solutions on Sovi AI
Photo-based solutions with guided steps
Explore more problems and detailed explanations
To sketch the graph of the football's height \( y \) (in feet) as a function of time \( x \) (in seconds), we analyze the given conditions:
Step 1: Identify Key Points
- \( y \)-intercept: At \( x = 0 \) (initial time), \( y = 8 \) (point: \( (0, 8) \)).
- Relative Maximum: At \( x = 2 \), \( y = 9 \) (point: \( (2, 9) \)).
- \( x \)-intercept: At \( x = 8 \), \( y = 0 \) (point: \( (8, 0) \)).
Step 2: Analyze Behavior
- Increasing/Decreasing:
- For \( 0 < x < 2 \), the function is increasing (rises from \( (0, 8) \) to \( (2, 9) \)).
- For \( 2 < x < 8 \), the function is decreasing (falls from \( (2, 9) \) to \( (8, 0) \)).
- Symmetry: The graph is symmetric about \( x = 2 \) (height at \( x = 2 - t \) equals height at \( x = 2 + t \)).
- End Behavior: For \( x < 0 \) or \( x > 8 \), \( y \) is not positive (so we only sketch \( 0 \leq x \leq 8 \)).
Step 3: Sketch the Graph
- Plot the points \( (0, 8) \), \( (2, 9) \), and \( (8, 0) \).
- Draw a smooth curve:
- From \( (0, 8) \) to \( (2, 9) \): A curve that rises (increasing).
- From \( (2, 9) \) to \( (8, 0) \): A curve that falls (decreasing), symmetric to the left side.
The graph is a parabola - shaped curve (or a nonlinear curve) opening downward, with vertex at \( (2, 9) \), passing through \( (0, 8) \) and \( (8, 0) \), increasing before \( x = 2 \), and decreasing after \( x = 2 \).
Final Graph Description
- Axes: Label the \( x \)-axis “Time (seconds)” and \( y \)-axis “Height (feet).”
- Plot the key points and draw the curve connecting them, ensuring symmetry about \( x = 2 \).
(Note: For a precise sketch, use graph paper or software to plot the points and draw the symmetric, nonlinear curve.)