QUESTION IMAGE
Question
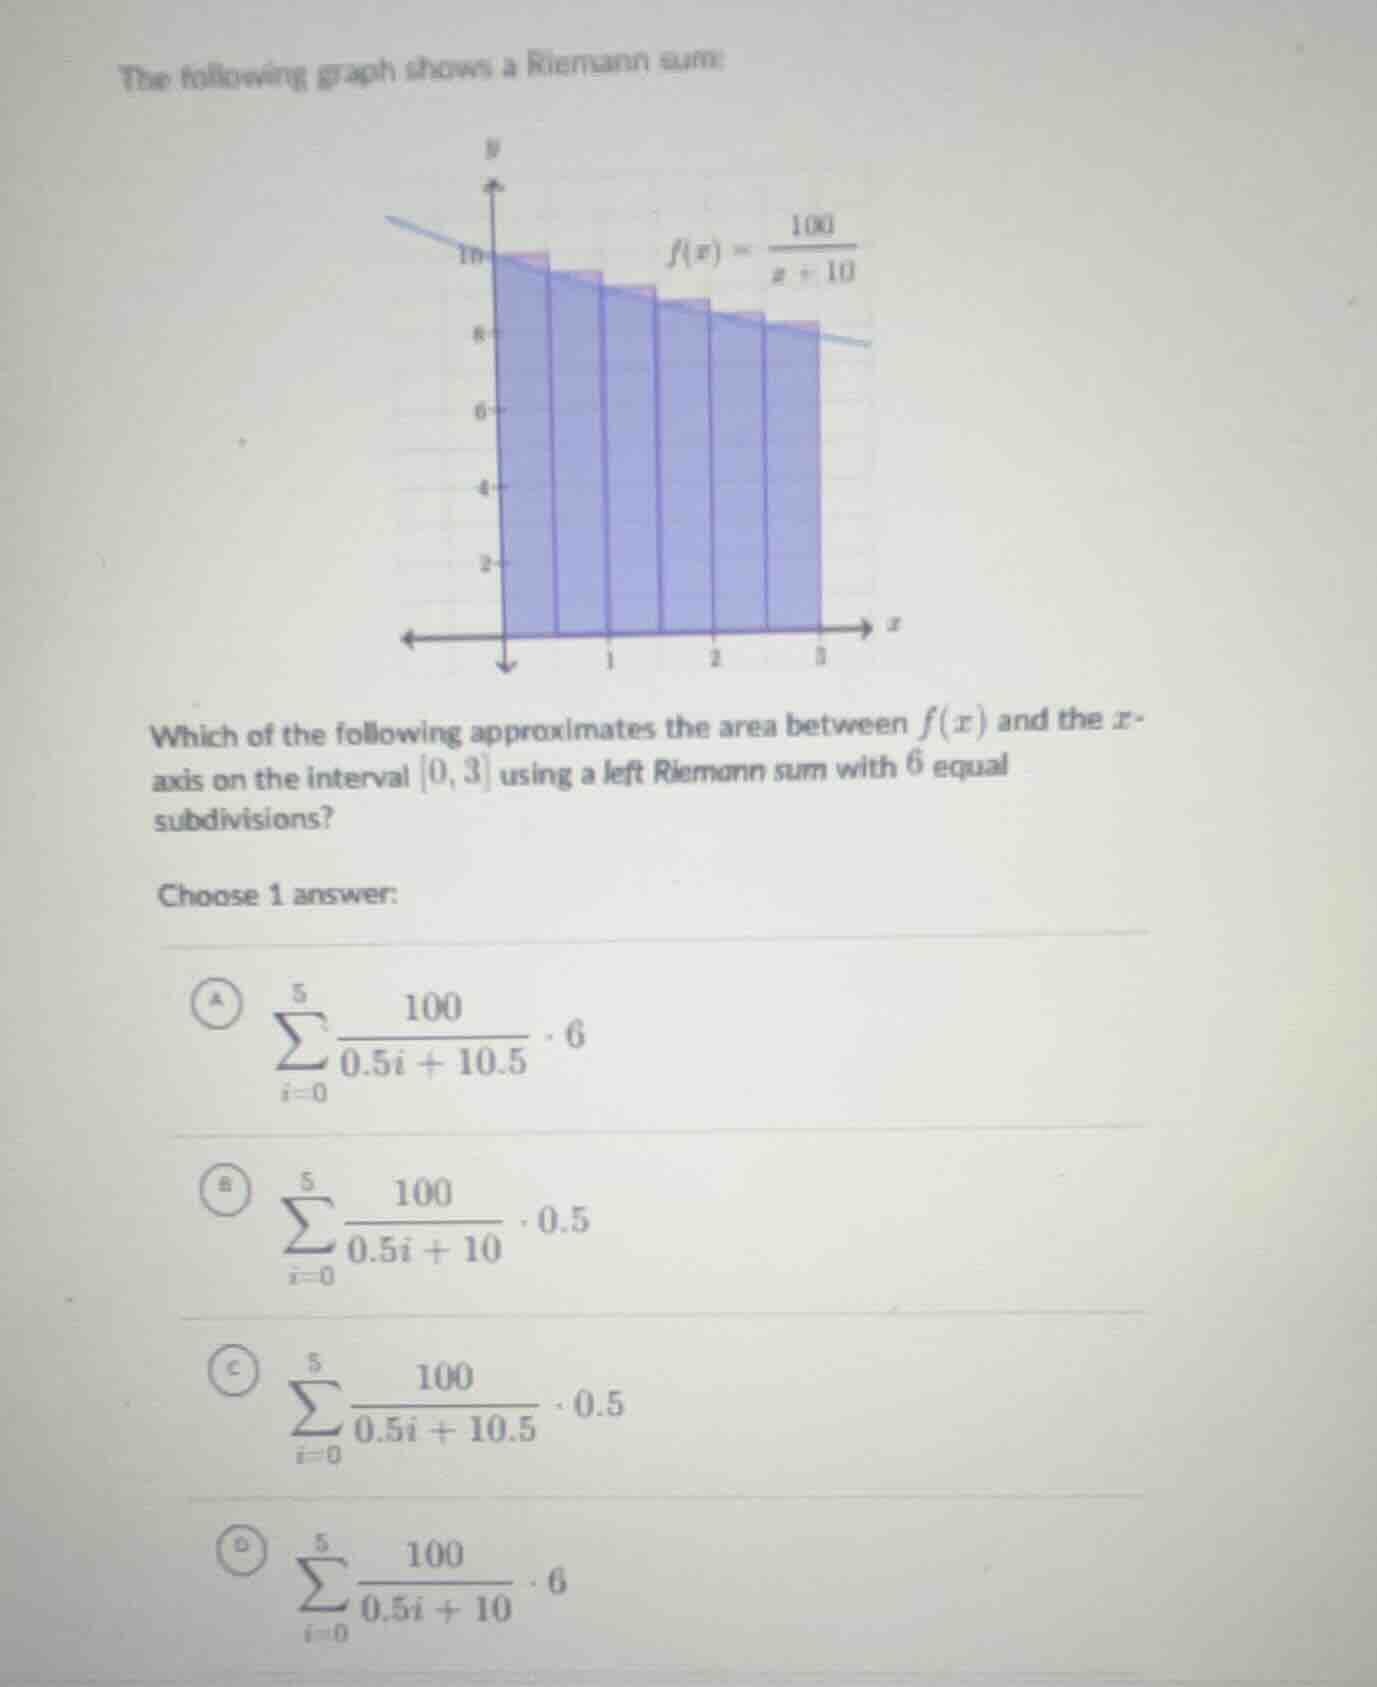
the following graph shows a riemann sum:
which of the following approximates the area between $f(x)$ and the $x$-axis on the interval $0, 3$ using a left riemann sum with 6 equal subdivisions?
choose 1 answer:
a $sum_{i = 0}^{5} \frac{100}{0.5i + 10.5} cdot 6$
b $sum_{i = 0}^{5} \frac{100}{0.5i + 10} cdot 0.5$
c $sum_{i = 0}^{5} \frac{100}{0.5i + 10.5} cdot 0.5$
d $sum_{i = 0}^{5} \frac{100}{0.5i + 10} cdot 6$
Step1: Calculate subinterval width
The interval is $[0,3]$ with 6 subdivisions. The width $\Delta x$ is $\frac{3-0}{6}=0.5$.
Step2: Define left sample points
For left Riemann sum, the $i$-th left point (starting at $i=0$) is $x_i = 0 + i\Delta x = 0.5i$.
Step3: Evaluate function at left points
Substitute $x_i$ into $f(x)=\frac{100}{x+10}$: $f(x_i)=\frac{100}{0.5i + 10}$.
Step4: Write left Riemann sum formula
The sum is $\sum_{i=0}^{n-1} f(x_i)\Delta x$, where $n=6$, so $\sum_{i=0}^{5} \frac{100}{0.5i + 10} \cdot 0.5$.

Snap & solve any problem in the app
Get step-by-step solutions on Sovi AI
Photo-based solutions with guided steps
Explore more problems and detailed explanations
B. $\sum_{i=0}^{5} \frac{100}{0.5i + 10} \cdot 0.5$