QUESTION IMAGE
Question
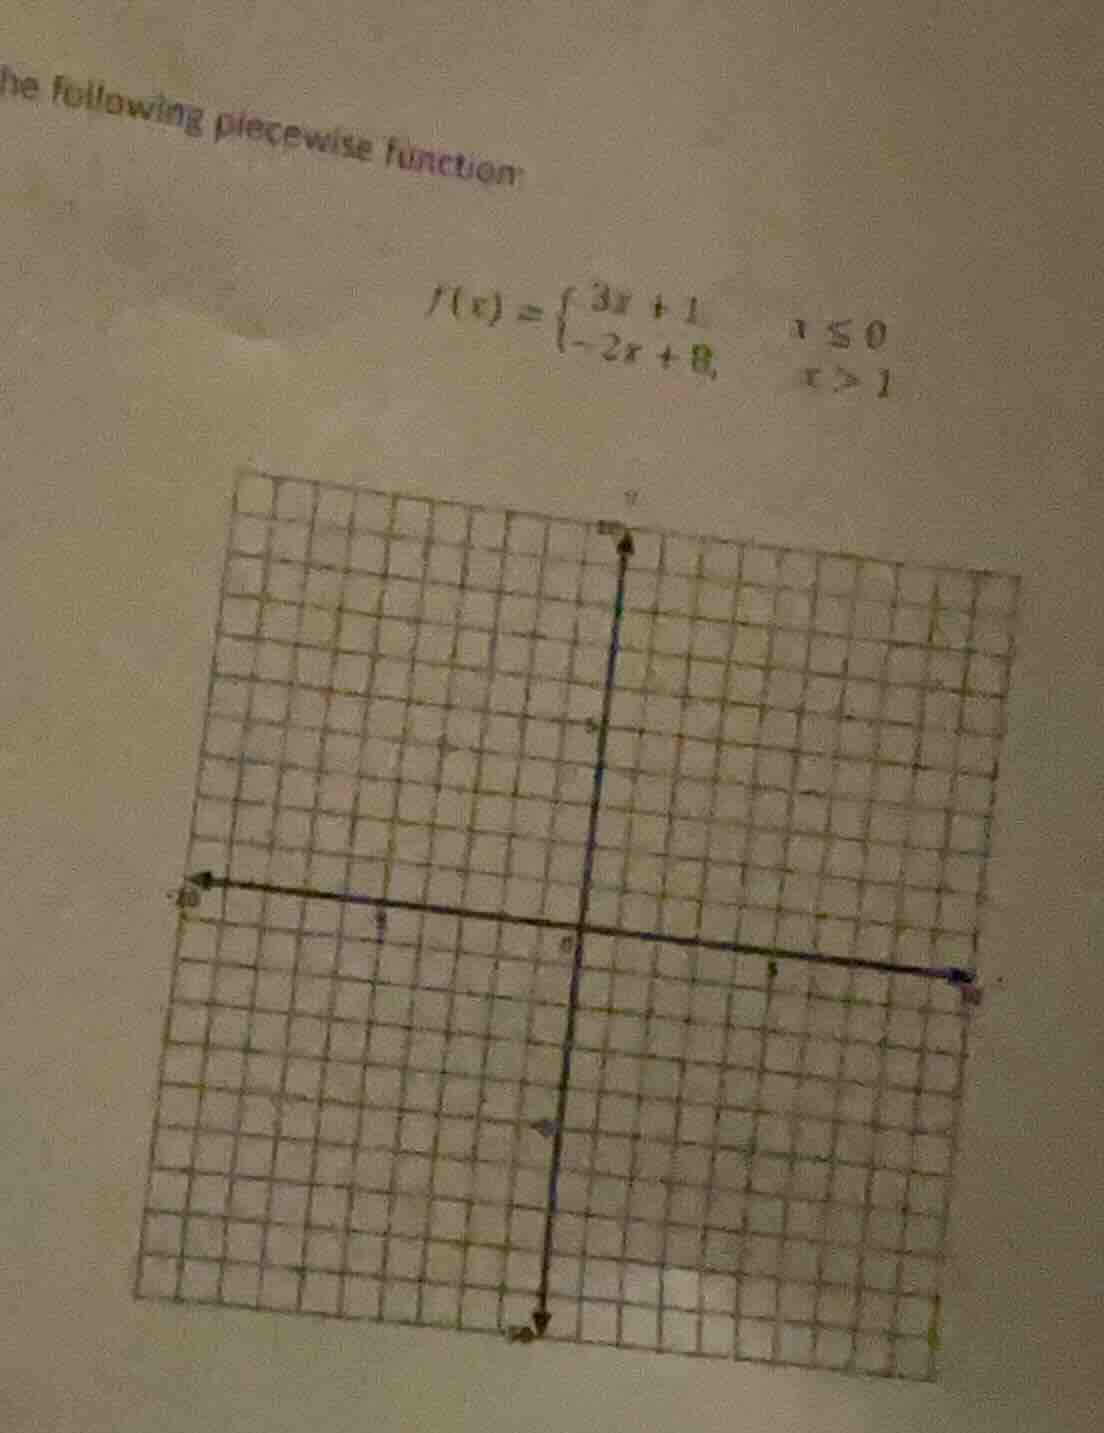
the following piecewise function:
$f(x) = \
$$\begin{cases} 3x + 1, & x \\leq 0 \\\\ -2x + 8, & x > 1 \\end{cases}$$
$
there is a coordinate grid chart below the function formula
Step1: Analyze the first piece (x ≤ 0)
For the function \( f(x) = 3x + 1 \) when \( x \leq 0 \), we can find some points. When \( x = 0 \), \( f(0)=3(0)+1 = 1 \). When \( x=-1 \), \( f(-1)=3(-1)+1=-2 \). So this is a line with slope 3, passing through (0,1) and (-1,-2).
Step2: Analyze the second piece (x > 1)
For the function \( f(x)=-2x + 8 \) when \( x > 1 \), when \( x = 2 \), \( f(2)=-2(2)+8 = 4 \). When \( x = 3 \), \( f(3)=-2(3)+8 = 2 \). This is a line with slope -2, passing through (2,4) and (3,2).
Step3: Plot the points and draw the lines
- For \( x \leq 0 \), draw the line \( y = 3x + 1 \) starting from the left (as \( x \) decreases) and ending at \( x = 0 \) (including the point (0,1) since \( x = 0 \) is in this domain).
- For \( x > 1 \), draw the line \( y=-2x + 8 \) starting just to the right of \( x = 1 \) (since \( x > 1 \), the point at \( x = 1 \) is not included) and going to the right. At \( x = 1 \), the value of the second function would be \( f(1)=-2(1)+8 = 6 \), but since \( x > 1 \), we start just after \( x = 1 \).

Snap & solve any problem in the app
Get step-by-step solutions on Sovi AI
Photo-based solutions with guided steps
Explore more problems and detailed explanations
To graph the piecewise function:
- For \( y = 3x + 1 \) (\( x \leq 0 \)): Plot points like (0,1), (-1,-2), etc., and draw a line with slope 3 through these points, including the point at \( x = 0 \).
- For \( y=-2x + 8 \) (\( x > 1 \)): Plot points like (2,4), (3,2), etc., and draw a line with slope -2 through these points, starting just to the right of \( x = 1 \) (not including \( x = 1 \)).