QUESTION IMAGE
Question
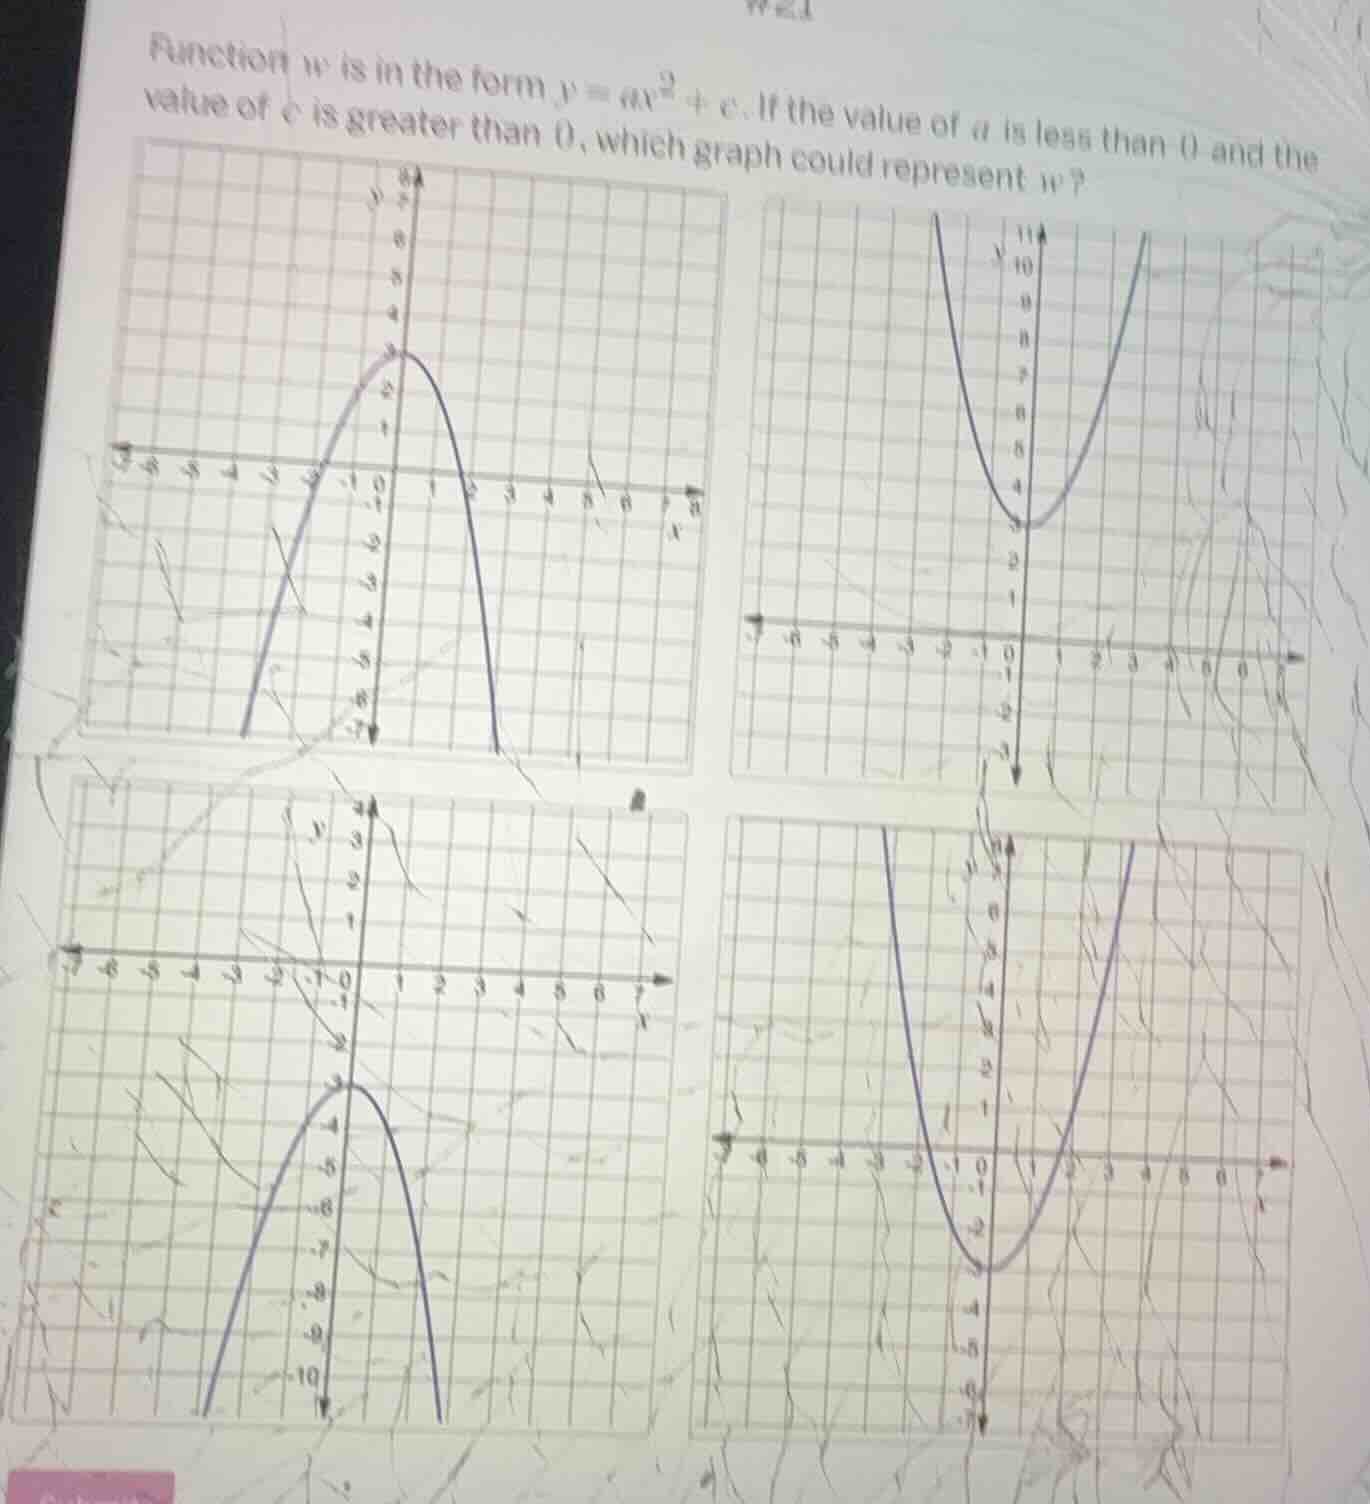
function w is in the form $y = ax^2 + c$. if the value of $a$ is less than 0 and the value of $c$ is greater than 0, which graph could represent $w$? four graphs are shown, two parabolas opening down and two opening up, with different y - intercepts
Step1: Analyze coefficient $a$
For the quadratic function $y=ax^2+c$, when $a<0$, the parabola opens downward (since negative $a$ causes the parabola to curve downward). This eliminates the two graphs that open upward (top-right and bottom-right).
Step2: Analyze constant term $c$
The constant $c$ is the $y$-intercept of the parabola (the value of $y$ when $x=0$). When $c>0$, the parabola intersects the $y$-axis at a positive value (above the origin). This eliminates the bottom-left graph, which intersects the $y$-axis at a negative value.
Step3: Match remaining graph
Only the top-left graph satisfies both conditions: it opens downward ($a<0$) and has a positive $y$-intercept ($c>0$).

Snap & solve any problem in the app
Get step-by-step solutions on Sovi AI
Photo-based solutions with guided steps
Explore more problems and detailed explanations
The top-left parabola (opens downward, has a $y$-intercept at positive $y=3$)