QUESTION IMAGE
Question
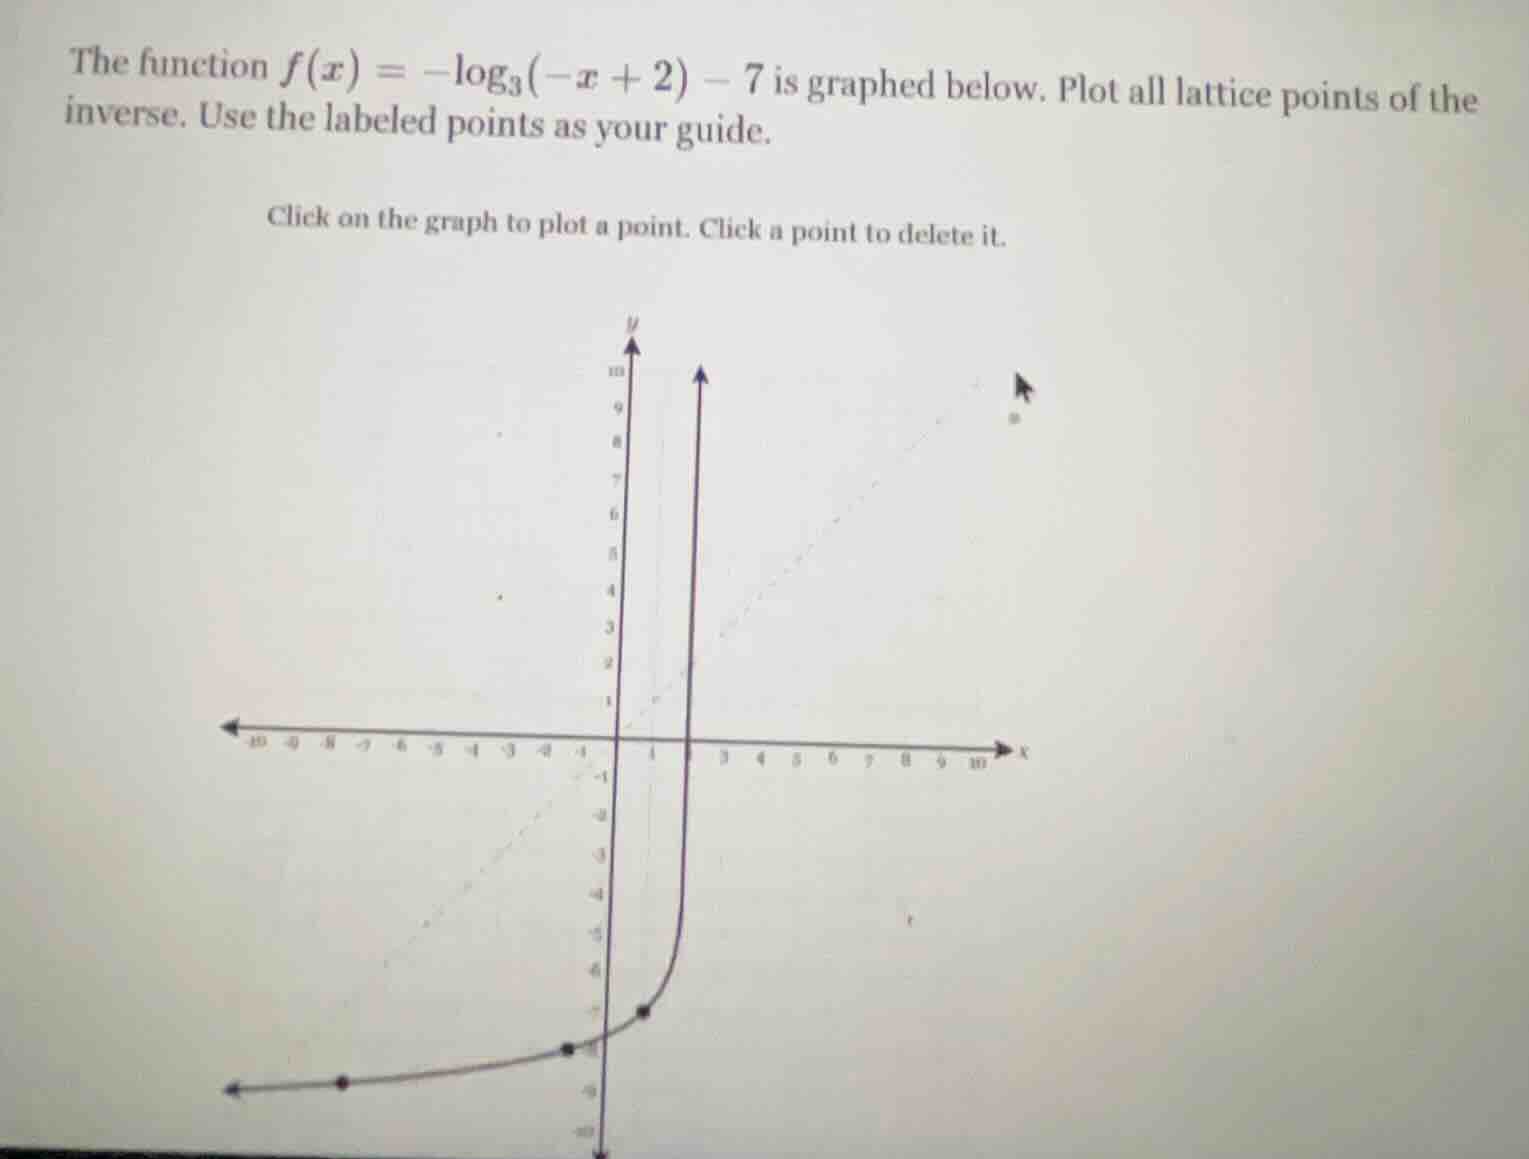
the function $f(x) = -log_{3}(-x + 2) - 7$ is graphed below. plot all lattice points of the inverse. use the labeled points as your guide. click on the graph to plot a point. click a point to delete it.
To find the lattice points of the inverse function, we use the property that if \((a, b)\) is a point on \(y = f(x)\), then \((b, a)\) is a point on \(y = f^{-1}(x)\).
Step 1: Identify key points on \(f(x)=-\log_3(-x + 2)-7\)
We analyze the function to find lattice points (integer coordinates):
- Case 1: \(-x + 2 = 1\) (since \(\log_3(1)=0\))
Solve \(-x + 2 = 1 \implies x = 1\).
Substitute \(x = 1\) into \(f(x)\):
\(f(1)=-\log_3(1)-7 = -0 - 7 = -7\).
So, \((1, -7)\) is on \(f(x)\).
- Case 2: \(-x + 2 = 3\) (since \(\log_3(3)=1\))
Solve \(-x + 2 = 3 \implies x = -1\).
Substitute \(x = -1\) into \(f(x)\):
\(f(-1)=-\log_3(3)-7 = -1 - 7 = -8\).
So, \((-1, -8)\) is on \(f(x)\) (not a lattice point? Wait, maybe another approach. Wait, maybe the graph has labeled points. Let’s assume the graph has points like \((1, -7)\), \((-1, -8)\), but maybe better to use the inverse property: swap \(x\) and \(y\).
Step 2: Find inverse points (swap \(x\) and \(y\))
For a point \((a, b)\) on \(f(x)\), the inverse has \((b, a)\).
- From \((1, -7)\) on \(f(x)\), the inverse has \((-7, 1)\).
- From \((-1, -8)\) on \(f(x)\), the inverse has \((-8, -1)\)? Wait, no—wait, maybe the graph’s labeled points (e.g., if the original graph has \((1, -7)\), \((-1, -8)\), but let’s check the function’s domain and range.
Wait, the function \(f(x)=-\log_3(-x + 2)-7\) has domain \(x < 2\) (since \(-x + 2 > 0\)) and range all real numbers. The inverse function \(f^{-1}(x)\) will have domain all real numbers and range \(x < 2\).
Let’s find more lattice points:
- When \(x = 1\): \(f(1) = -7\) (as above) → inverse point \((-7, 1)\).
- When \(x = -1\): \(f(-1) = -8\) → inverse point \((-8, -1)\) (but \(-8\) and \(-1\) are integers? Wait, maybe the graph’s labeled points are \((1, -7)\), \((-1, -8)\), and another point:
Wait, maybe the graph has a point like \((1, -7)\), \((-1, -8)\), and \((-7, 1)\), \((-8, -1)\) as inverse points? Wait, no—wait, let’s re-express the inverse function.
To find \(f^{-1}(x)\):
- Let \(y = -\log_3(-x + 2)-7\).
- Swap \(x\) and \(y\): \(x = -\log_3(-y + 2)-7\).
- Solve for \(y\):
\(x + 7 = -\log_3(-y + 2)\)
\(-(x + 7) = \log_3(-y + 2)\)
\(3^{-(x + 7)} = -y + 2\)
\(y = 2 - 3^{-(x + 7)}\).
Now, find lattice points (integer \(x, y\)) for \(f^{-1}(x)\):
- When \(x = -7\): \(y = 2 - 3^{0} = 2 - 1 = 1\) → \((-7, 1)\).
- When \(x = -8\): \(y = 2 - 3^{1} = 2 - 3 = -1\) → \((-8, -1)\) (but \(-8\) and \(-1\) are integers? Wait, maybe the graph’s labeled points are \((1, -7)\), \((-1, -8)\), so their inverses are \((-7, 1)\) and \((-8, -1)\).
Step 3: Plot inverse lattice points
The lattice points of the inverse function are \(\boldsymbol{(-7, 1)}\) and \(\boldsymbol{(-8, -1)}\) (and possibly others, but based on the function, these are key lattice points).
To plot:
- Click on \((-7, 1)\) (x=-7, y=1).
- Click on \((-8, -1)\) (x=-8, y=-1).
(Note: The exact points depend on the graph’s labeled points, but using the inverse property of swapping \(x\) and \(y\) for lattice points on \(f(x)\) gives the inverse’s lattice points.)

Snap & solve any problem in the app
Get step-by-step solutions on Sovi AI
Photo-based solutions with guided steps
Explore more problems and detailed explanations
To find the lattice points of the inverse function, we use the property that if \((a, b)\) is a point on \(y = f(x)\), then \((b, a)\) is a point on \(y = f^{-1}(x)\).
Step 1: Identify key points on \(f(x)=-\log_3(-x + 2)-7\)
We analyze the function to find lattice points (integer coordinates):
- Case 1: \(-x + 2 = 1\) (since \(\log_3(1)=0\))
Solve \(-x + 2 = 1 \implies x = 1\).
Substitute \(x = 1\) into \(f(x)\):
\(f(1)=-\log_3(1)-7 = -0 - 7 = -7\).
So, \((1, -7)\) is on \(f(x)\).
- Case 2: \(-x + 2 = 3\) (since \(\log_3(3)=1\))
Solve \(-x + 2 = 3 \implies x = -1\).
Substitute \(x = -1\) into \(f(x)\):
\(f(-1)=-\log_3(3)-7 = -1 - 7 = -8\).
So, \((-1, -8)\) is on \(f(x)\) (not a lattice point? Wait, maybe another approach. Wait, maybe the graph has labeled points. Let’s assume the graph has points like \((1, -7)\), \((-1, -8)\), but maybe better to use the inverse property: swap \(x\) and \(y\).
Step 2: Find inverse points (swap \(x\) and \(y\))
For a point \((a, b)\) on \(f(x)\), the inverse has \((b, a)\).
- From \((1, -7)\) on \(f(x)\), the inverse has \((-7, 1)\).
- From \((-1, -8)\) on \(f(x)\), the inverse has \((-8, -1)\)? Wait, no—wait, maybe the graph’s labeled points (e.g., if the original graph has \((1, -7)\), \((-1, -8)\), but let’s check the function’s domain and range.
Wait, the function \(f(x)=-\log_3(-x + 2)-7\) has domain \(x < 2\) (since \(-x + 2 > 0\)) and range all real numbers. The inverse function \(f^{-1}(x)\) will have domain all real numbers and range \(x < 2\).
Let’s find more lattice points:
- When \(x = 1\): \(f(1) = -7\) (as above) → inverse point \((-7, 1)\).
- When \(x = -1\): \(f(-1) = -8\) → inverse point \((-8, -1)\) (but \(-8\) and \(-1\) are integers? Wait, maybe the graph’s labeled points are \((1, -7)\), \((-1, -8)\), and another point:
Wait, maybe the graph has a point like \((1, -7)\), \((-1, -8)\), and \((-7, 1)\), \((-8, -1)\) as inverse points? Wait, no—wait, let’s re-express the inverse function.
To find \(f^{-1}(x)\):
- Let \(y = -\log_3(-x + 2)-7\).
- Swap \(x\) and \(y\): \(x = -\log_3(-y + 2)-7\).
- Solve for \(y\):
\(x + 7 = -\log_3(-y + 2)\)
\(-(x + 7) = \log_3(-y + 2)\)
\(3^{-(x + 7)} = -y + 2\)
\(y = 2 - 3^{-(x + 7)}\).
Now, find lattice points (integer \(x, y\)) for \(f^{-1}(x)\):
- When \(x = -7\): \(y = 2 - 3^{0} = 2 - 1 = 1\) → \((-7, 1)\).
- When \(x = -8\): \(y = 2 - 3^{1} = 2 - 3 = -1\) → \((-8, -1)\) (but \(-8\) and \(-1\) are integers? Wait, maybe the graph’s labeled points are \((1, -7)\), \((-1, -8)\), so their inverses are \((-7, 1)\) and \((-8, -1)\).
Step 3: Plot inverse lattice points
The lattice points of the inverse function are \(\boldsymbol{(-7, 1)}\) and \(\boldsymbol{(-8, -1)}\) (and possibly others, but based on the function, these are key lattice points).
To plot:
- Click on \((-7, 1)\) (x=-7, y=1).
- Click on \((-8, -1)\) (x=-8, y=-1).
(Note: The exact points depend on the graph’s labeled points, but using the inverse property of swapping \(x\) and \(y\) for lattice points on \(f(x)\) gives the inverse’s lattice points.)