QUESTION IMAGE
Question
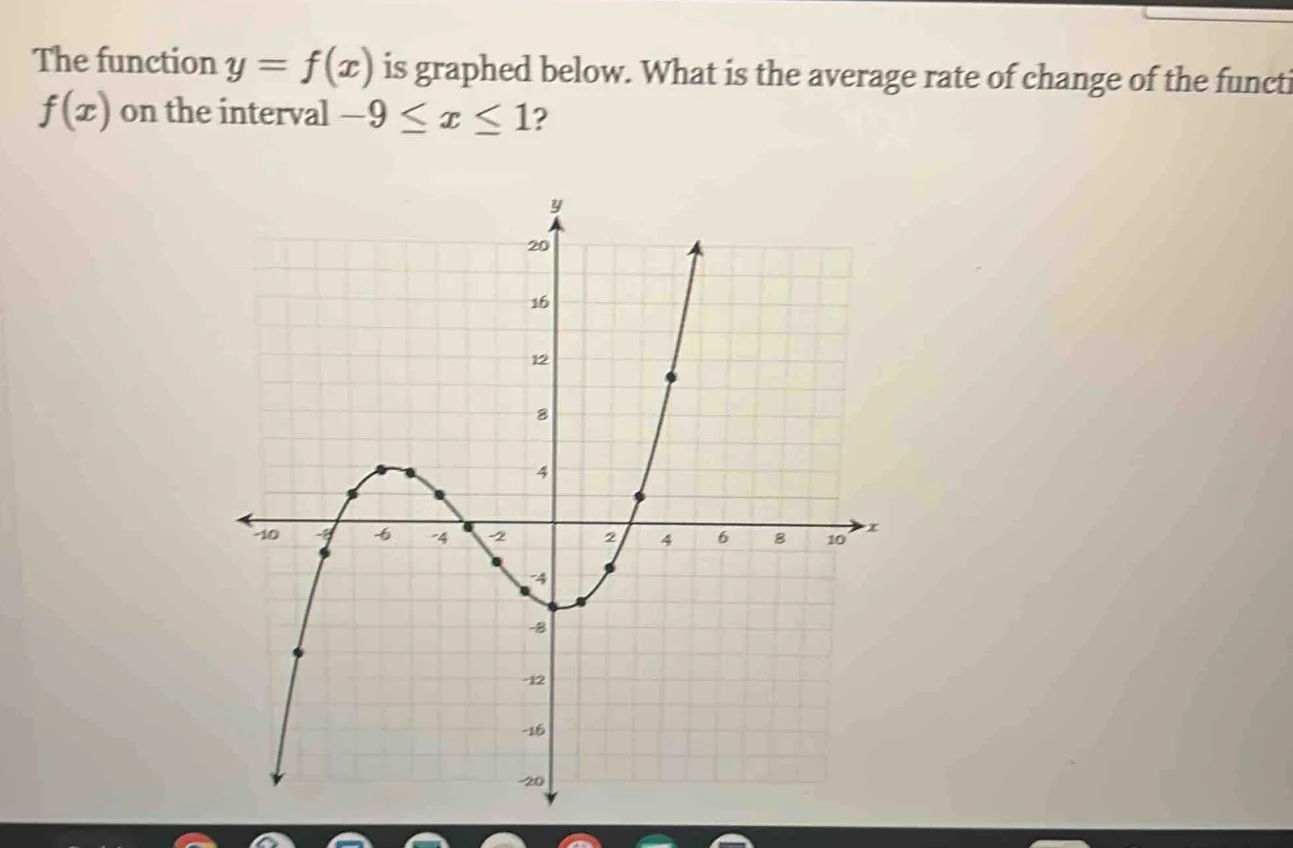
the function $y = f(x)$ is graphed below. what is the average rate of change of the functi $f(x)$ on the interval $-9 \leq x \leq 1$?
Step1: Find f(-9) and f(1)
From the graph, when \( x = -9 \), we look at the point on the graph. The y - value (f(-9)) seems to be - 10? Wait, no, let's check the grid. Wait, at x=-9, the point is at ( - 9, - 10)? Wait, no, looking at the graph, when x = - 9, the y - coordinate: let's see the grid. Each square is 1 unit? Wait, the left part: at x=-9, the point is ( - 9, - 10)? Wait, no, maybe I misread. Wait, when x = - 9, let's check the graph. Wait, the graph at x=-9: the point is ( - 9, - 10)? Wait, no, maybe x=-8: at x=-8, the point is ( - 8, - 4)? Wait, no, let's re - examine. Wait, the interval is \(-9\leq x\leq1\). So we need to find f(-9) and f(1).
Looking at the graph:
For \( x=-9 \): Let's see the coordinates. The graph at x = - 9: the y - value. Let's check the grid. The vertical axis (y - axis) and horizontal axis (x - axis) with each grid square as 1 unit. At x=-9, the point is ( - 9, - 10)? Wait, no, maybe I made a mistake. Wait, when x=-9, the point is ( - 9, - 10)? Wait, no, let's look at the leftmost part. Wait, the graph at x=-9: let's see, when x=-9, the y - coordinate is - 10? Wait, no, maybe x=-9: the point is ( - 9, - 10), and at x = 1, the point is (1, - 4)? Wait, no, let's check the graph again. Wait, at x = 1, looking at the graph, the point is (1, - 4)? Wait, no, the graph at x = 1: let's see, the curve at x = 1, the y - value. Wait, maybe I should look at the coordinates more carefully.
Wait, the formula for the average rate of change of a function \( y = f(x) \) on the interval \([a,b]\) is \( \frac{f(b)-f(a)}{b - a} \). Here, \( a=-9 \), \( b = 1 \).
So we need to find \( f(-9) \) and \( f(1) \) from the graph.
Looking at the graph:
- When \( x=-9 \), the point on the graph is ( - 9, - 10) (assuming each grid square is 1 unit, so moving 9 units left on x - axis and 10 units down on y - axis).
- When \( x = 1 \), the point on the graph is (1, - 4) (1 unit right on x - axis and 4 units down on y - axis).
Step2: Apply the average rate of change formula
The formula for the average rate of change of a function \( f(x) \) on the interval \([a,b]\) is \( \text{Average Rate of Change}=\frac{f(b)-f(a)}{b - a} \)
Here, \( a=-9 \), \( b = 1 \), \( f(a)=f(-9)=-10 \), \( f(b)=f(1)=-4 \)
Substitute into the formula:
\( \text{Average Rate of Change}=\frac{f(1)-f(-9)}{1-(-9)}=\frac{-4-(-10)}{1 + 9}=\frac{-4 + 10}{10}=\frac{6}{10}=\frac{3}{5}=0.6 \)
Wait, wait, maybe I made a mistake in reading the graph. Let's re - check the graph.
Wait, at x=-9: Let's look at the graph again. The point at x=-9: maybe the y - value is - 10? Wait, no, maybe x=-9: the point is ( - 9, - 10), and at x = 1, the point is (1, - 4). Then the difference in y is \( f(1)-f(-9)=-4-(-10)=6 \), and the difference in x is \( 1-(-9)=10 \), so the average rate of change is \( \frac{6}{10}=0.6=\frac{3}{5} \).
Wait, but maybe I misread the graph. Let's check again. Wait, when x=-9, the point is ( - 9, - 10)? Wait, no, maybe x=-9: the y - value is - 10, and at x = 1, the y - value is - 4. So the calculation is \( \frac{-4-(-10)}{1-(-9)}=\frac{6}{10}=\frac{3}{5} \).
Wait, another way: maybe the graph at x=-9: the point is ( - 9, - 10), and at x = 1, the point is (1, - 4). So the average rate of change is \( \frac{f(1)-f(-9)}{1 - (-9)}=\frac{-4-(-10)}{10}=\frac{6}{10}=\frac{3}{5} \).

Snap & solve any problem in the app
Get step-by-step solutions on Sovi AI
Photo-based solutions with guided steps
Explore more problems and detailed explanations
\(\frac{3}{5}\) (or 0.6)