QUESTION IMAGE
Question
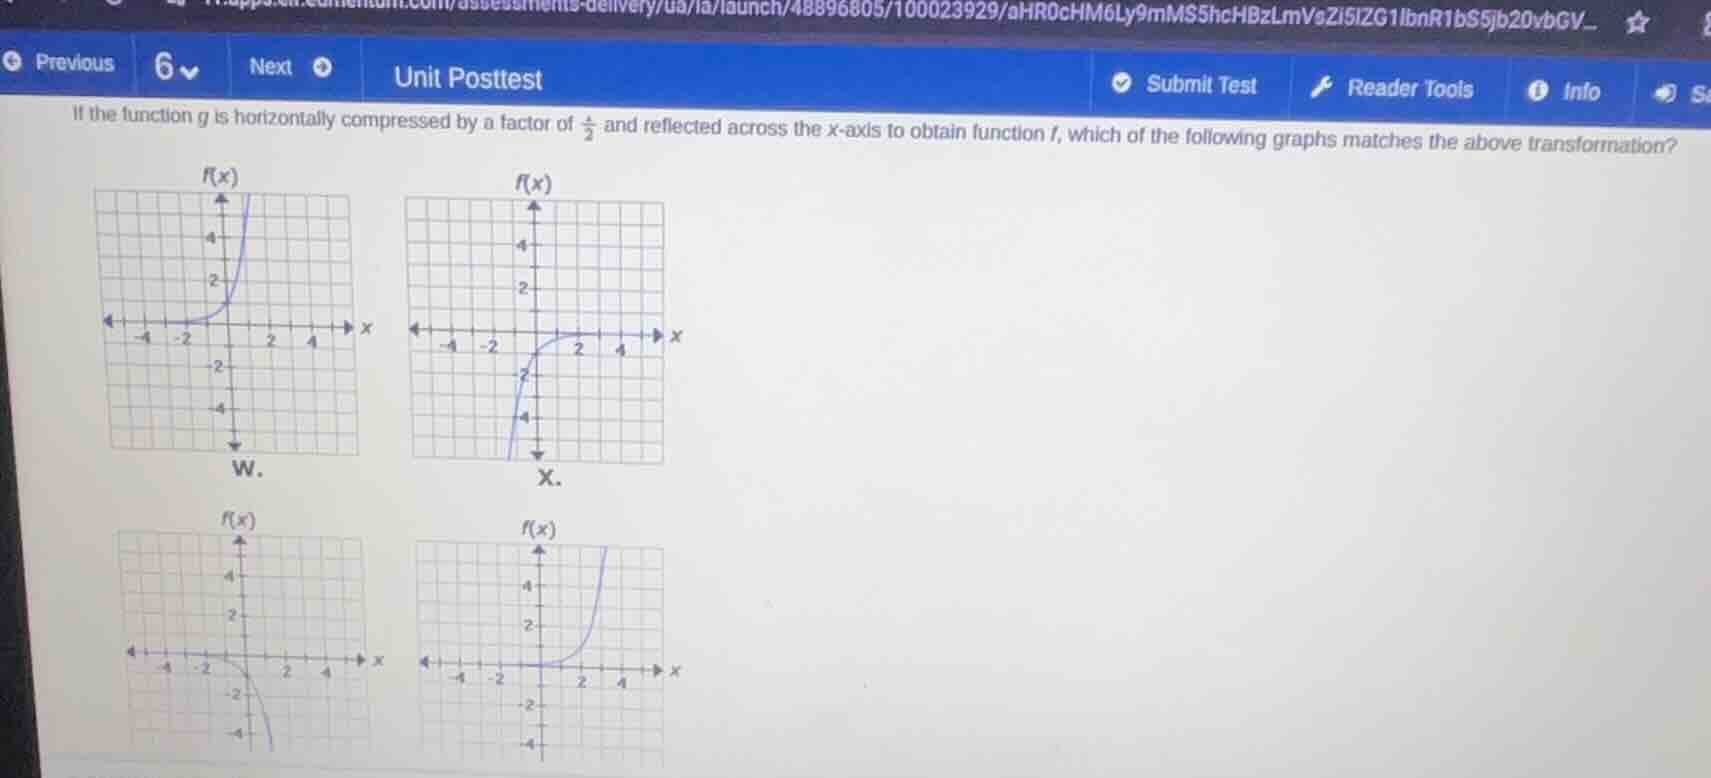
if the function g is horizontally compressed by a factor of \\(\frac{1}{2}\\) and reflected across the x - axis to obtain function f, which of the following graphs matches the above transformation?
To solve this, we analyze the transformations of the function \( g \) to get \( f \):
Step 1: Recall Transformations
- Horizontal Compression by \( \frac{1}{2} \): For a function \( y = g(x) \), horizontal compression by factor \( \frac{1}{2} \) gives \( y = g(2x) \) (since \( \text{compression factor } b > 1 \) means replace \( x \) with \( bx \)).
- Reflection over \( x \)-axis: Changes \( y = g(2x) \) to \( y = -g(2x) \) (multiply the function by \( -1 \)).
Step 2: Analyze the Graphs
Assume \( g(x) \) is an exponential function (e.g., \( g(x) = 2^x \), increasing, passes through \( (0,1) \)).
- Horizontal Compression: \( g(2x) = 2^{2x} = 4^x \), which is steeper (compressed) than \( 2^x \).
- Reflection over \( x \)-axis: \( f(x) = -4^x \), which is decreasing (since the negative flips it over the \( x \)-axis) and passes through \( (0, -1) \) (because \( f(0) = -4^0 = -1 \)).
Step 3: Match the Graph
- Graphs W and the bottom-right are increasing (no reflection) → eliminate.
- Graph X is decreasing but check the \( y \)-intercept: If \( f(x) = -4^x \), at \( x=0 \), \( f(0) = -1 \), but X has a \( y \)-intercept of \( -2 \) (approx) → inconsistent.
- The bottom-left graph (let’s call it Y) is decreasing, passes through \( (0, -1) \) (or near \( -1 \)) and is steeper (compressed) → matches \( f(x) = -g(2x) \).

Snap & solve any problem in the app
Get step-by-step solutions on Sovi AI
Photo-based solutions with guided steps
Explore more problems and detailed explanations
The bottom - left graph (the one with \( f(x) \) decreasing, passing near \( (0, - 1) \) and having a steep, downward - sloping curve) matches the transformation. If we assume the options are labeled as W, X, Y (bottom - left), Z (bottom - right), the answer is the bottom - left graph (e.g., if it’s labeled as the third graph, that’s the one).