QUESTION IMAGE
Question
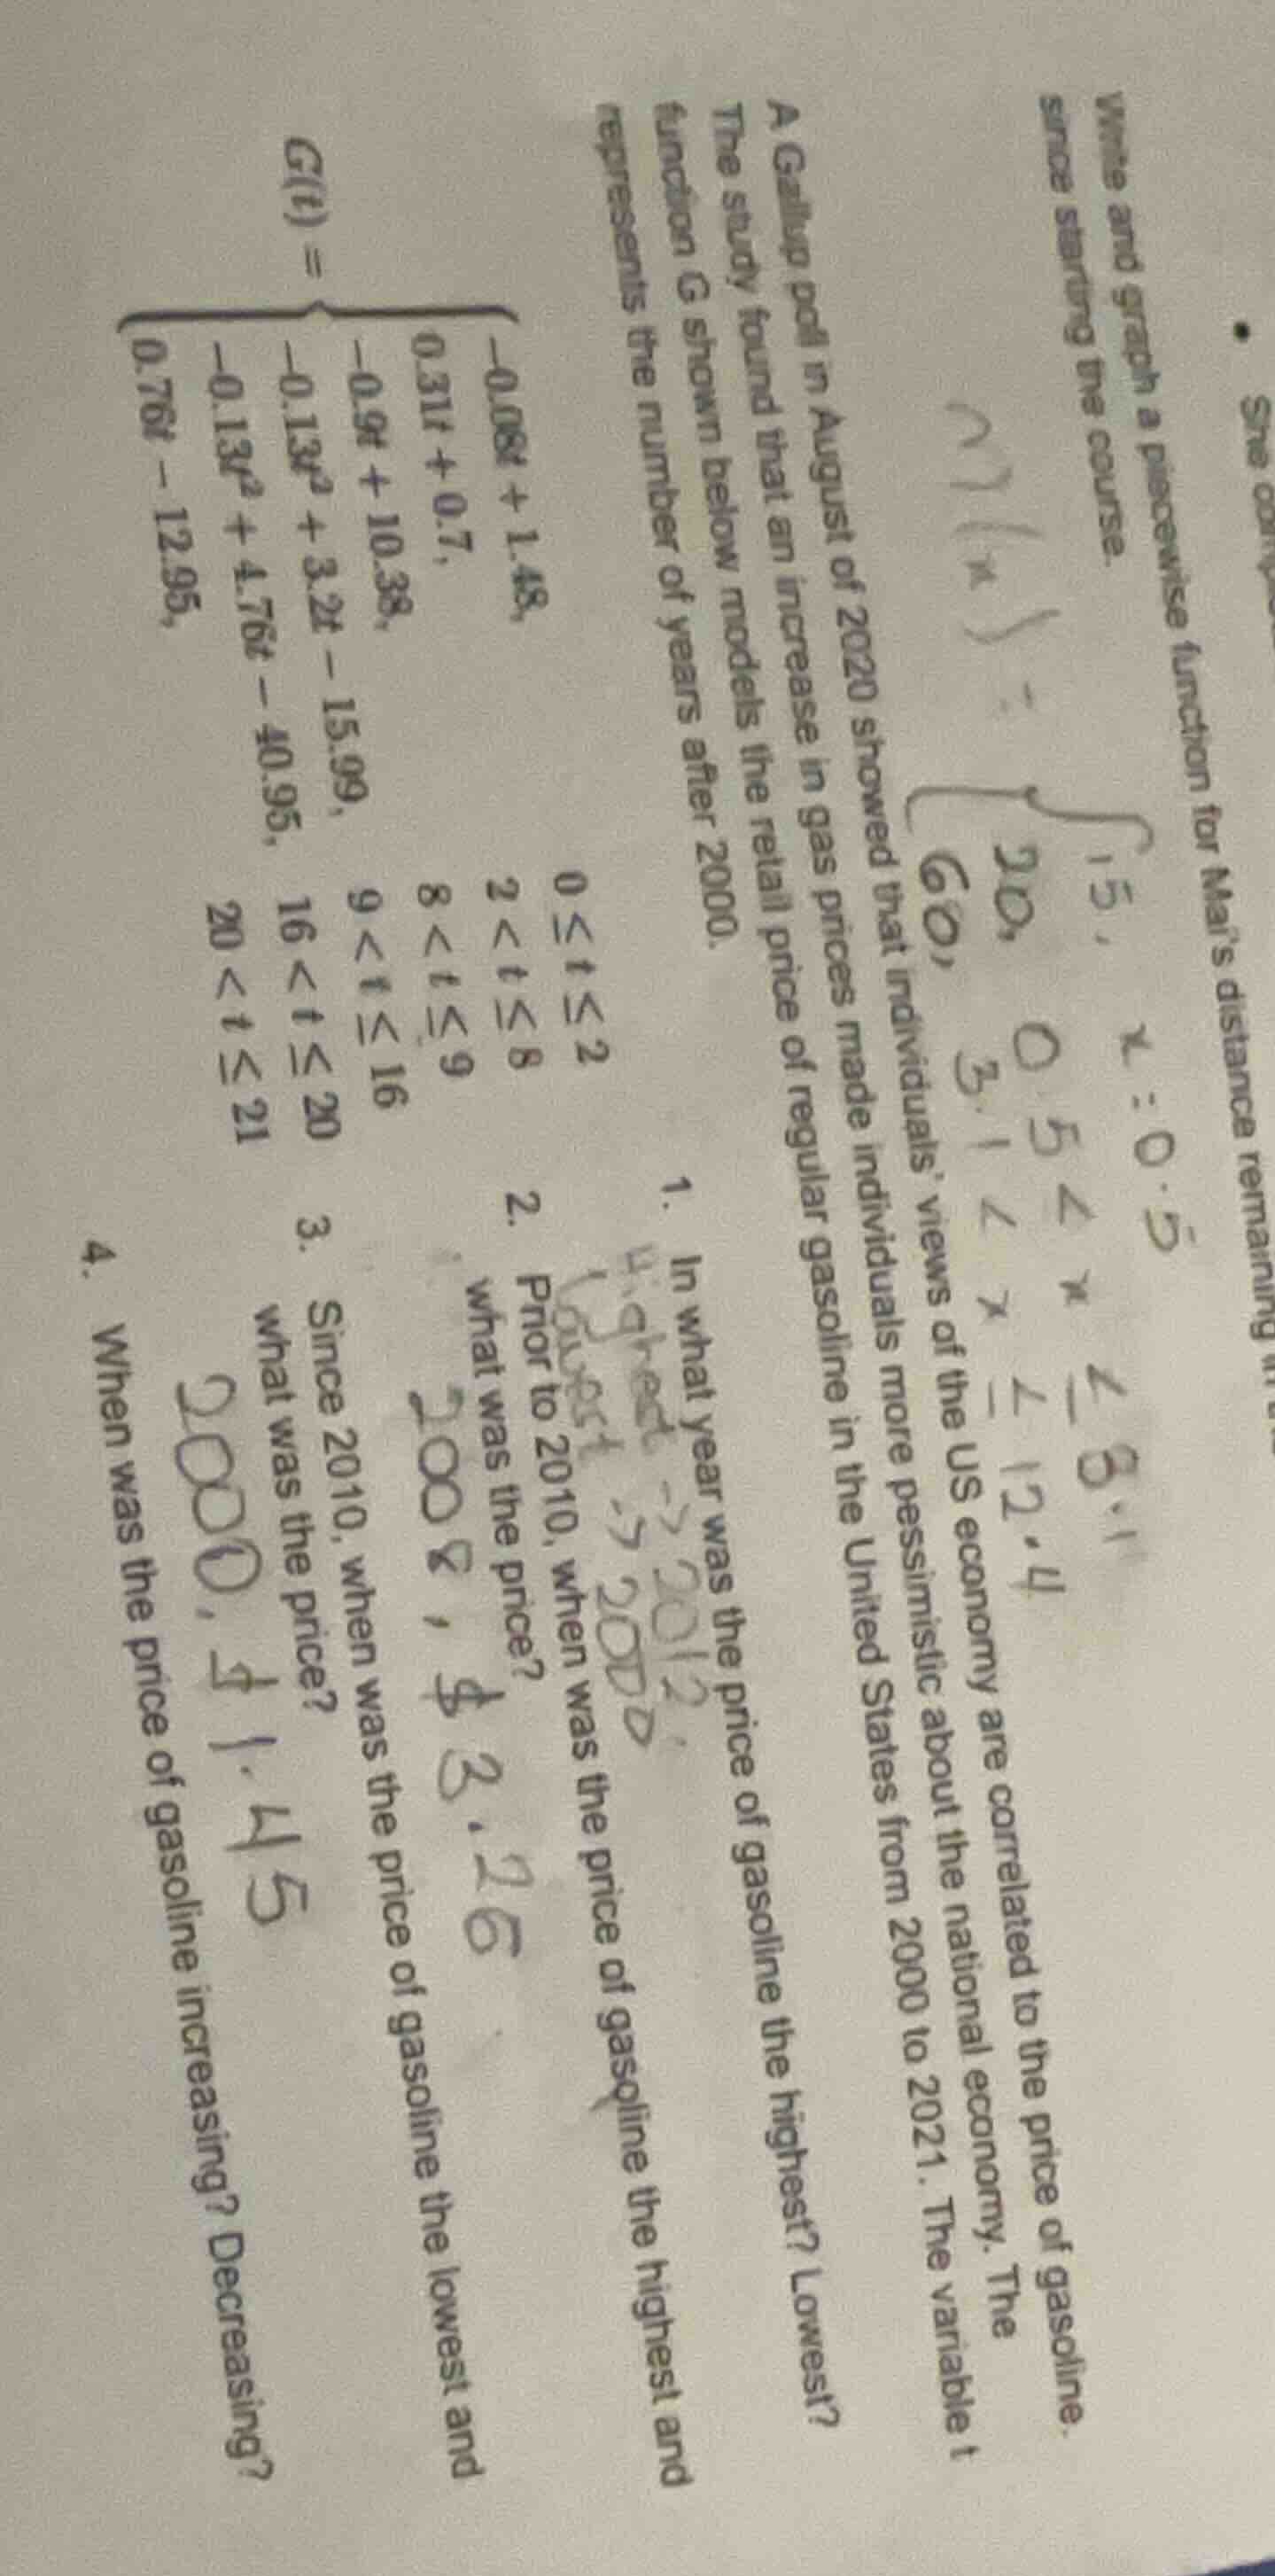
a gallup poll in august of 2020 showed that individuals’ views of the us economy are correlated to the price of gasoline. the study found that an increase in gas prices made individuals more pessimistic about the national economy. the function ( g ) shown below models the retail price of regular gasoline in the united states from 2000 to 2021. the variable ( t ) represents the number of years after 2000. g(t) = \begin{cases} -0.008t + 1.48, & 0 leq t leq 2 \\ 0.31t + 0.7, & 2 < t leq 8 \\ -0.9t + 10.38, & 8 < t leq 9 \\ -0.13t^2 + 3.2t - 15.09, & 9 < t leq 16 \\ -0.13t^2 + 4.76t - 40.95, & 16 < t leq 20 \\ 0.76t - 12.95, & 20 < t leq 21 end{cases} 1. in what year was the price of gasoline the highest? lowest? 2. prior to 2010, when was the price of gasoline the highest and what was the price? 3. since 2010, when was the price of gasoline the lowest and what was the price? 4. when was the price of gasoline increasing? decreasing?
Step1: Analyze each piece's extrema
For $0 \leq t \leq 2$: $G(t)=-0.08t+1.48$
This is a linear function with slope $-0.08<0$, so it decreases from $G(0)=1.48$ to $G(2)=-0.08(2)+1.48=1.32$.
For $2 < t \leq 8$: $G(t)=0.31t+0.7$
Linear with slope $0.31>0$, increases from $G(2)=0.31(2)+0.7=1.32$ to $G(8)=0.31(8)+0.7=3.18$.
For $8 < t \leq 9$: $G(t)=-0.9t+10.38$
Linear with slope $-0.9<0$, decreases from $G(8)=-0.9(8)+10.38=3.18$ to $G(9)=-0.9(9)+10.38=2.28$.
For $9 < t \leq 16$: $G(t)=-0.13t^2+3.2t-15.99$
This is a quadratic with $a=-0.13<0$, vertex at $t=-\frac{b}{2a}=-\frac{3.2}{2(-0.13)}\approx12.31$ (within $9
Endpoints: $G(9)=2.28$, $G(16)=-0.13(16)^2+3.2(16)-15.99=2.23$.
For $16 < t \leq 20$: $G(t)=-0.13t^2+4.76t-40.95$
Quadratic with $a=-0.13<0$, vertex at $t=-\frac{4.76}{2(-0.13)}\approx18.31$ (within $16
Endpoints: $G(16)=-0.13(16)^2+4.76(16)-40.95=3.91$, $G(20)=-0.13(20)^2+4.76(20)-40.95=3.25$.
For $20 < t \leq 21$: $G(t)=0.76t-12.95$
Linear with slope $0.76>0$, increases from $G(20)=0.76(20)-12.95=2.25$ to $G(21)=0.76(21)-12.95=3.01$.
Step2: Compare all extrema for Q1
Highest value $\approx4.46$ at $t\approx12.31$, so year $2000+12=2012$.
Lowest value is $1.32$ at $t=2$, year $2000+2=2002$.
Step3: Find pre-2010 (t<10) extrema for Q2
From Step1, pre-2010 max is $G(8)=3.18$ (year 2008), min is $G(2)=1.32$ (year 2002).
Step4: Find 2010+ (t≥10) extrema for Q3
From Step1, $t\geq10$ max is $\approx4.46$ (2012), min is $G(20)=2.25$ (2020).
Step5: Analyze slopes for Q4
- $0 \leq t \leq 2$: slope $-0.08<0$ → decreasing (2000-2002)
- $2 < t \leq 8$: slope $0.31>0$ → increasing (2002-2008)
- $8 < t \leq 9$: slope $-0.9<0$ → decreasing (2008-2009)
- $9 < t \leq 12.31$: quadratic opens down, vertex at ~12.31 → increasing (2009-2012)
- $12.31 < t \leq 20$: quadratic opens down → decreasing (2012-2020)
- $20 < t \leq 21$: slope $0.76>0$ → increasing (2020-2021)

Snap & solve any problem in the app
Get step-by-step solutions on Sovi AI
Photo-based solutions with guided steps
Explore more problems and detailed explanations
- Highest: 2012; Lowest: 2002
- Highest (pre-2010): 2008, price $\$3.18$; Lowest (pre-2010): 2002, price $\$1.32$
- Highest (2010+): 2012, price $\approx\$4.46$; Lowest (2010+): 2020, price $\$2.25$
- Increasing: 2002-2008, 2009-2012, 2020-2021; Decreasing: 2000-2002, 2008-2009, 2012-2020