QUESTION IMAGE
Question
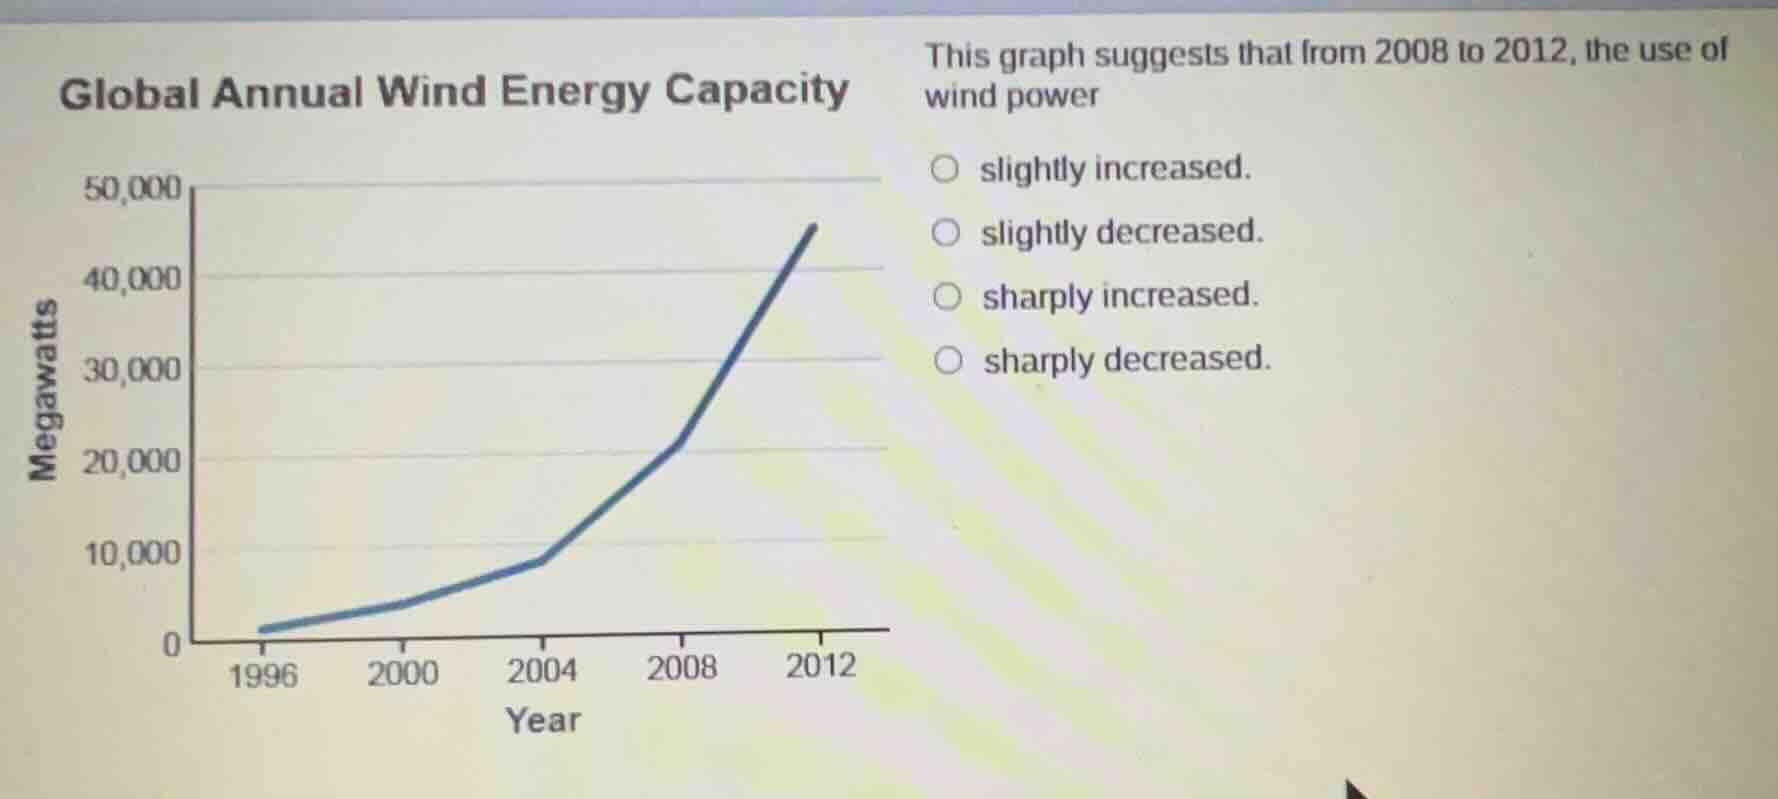
global annual wind energy capacity
this graph suggests that from 2008 to 2012, the use of wind power
slightly increased.
slightly decreased.
sharply increased.
sharply decreased.
Brief Explanations
Looking at the graph, in 2008 the global wind energy capacity is around 22,000 megawatts, and by 2012 it rises to over 45,000 megawatts. This represents a very large, rapid upward change, not a small increase or any decrease.

Snap & solve any problem in the app
Get step-by-step solutions on Sovi AI
Photo-based solutions with guided steps
Explore more problems and detailed explanations
sharply increased.