QUESTION IMAGE
Question
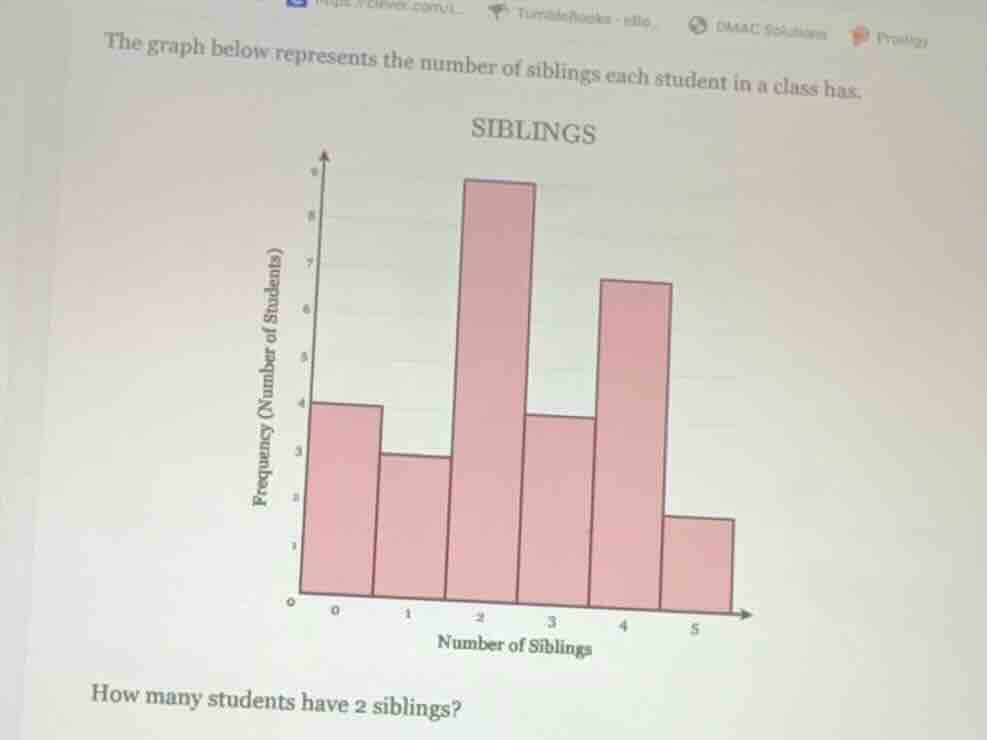
the graph below represents the number of siblings each student in a class has.
siblings
frequency (number of students)
0 0 1 2 3 4 5
number of siblings
how many students have 2 siblings?
Step1: Identify the bar for 2 siblings
Look at the bar graph where the x - axis is "Number of Siblings" and find the bar corresponding to 2 siblings.
Step2: Read the frequency (y - axis)
The y - axis represents the frequency (number of students). The bar for 2 siblings reaches up to 9 on the y - axis.

Snap & solve any problem in the app
Get step-by-step solutions on Sovi AI
Photo-based solutions with guided steps
Explore more problems and detailed explanations
9