QUESTION IMAGE
Question
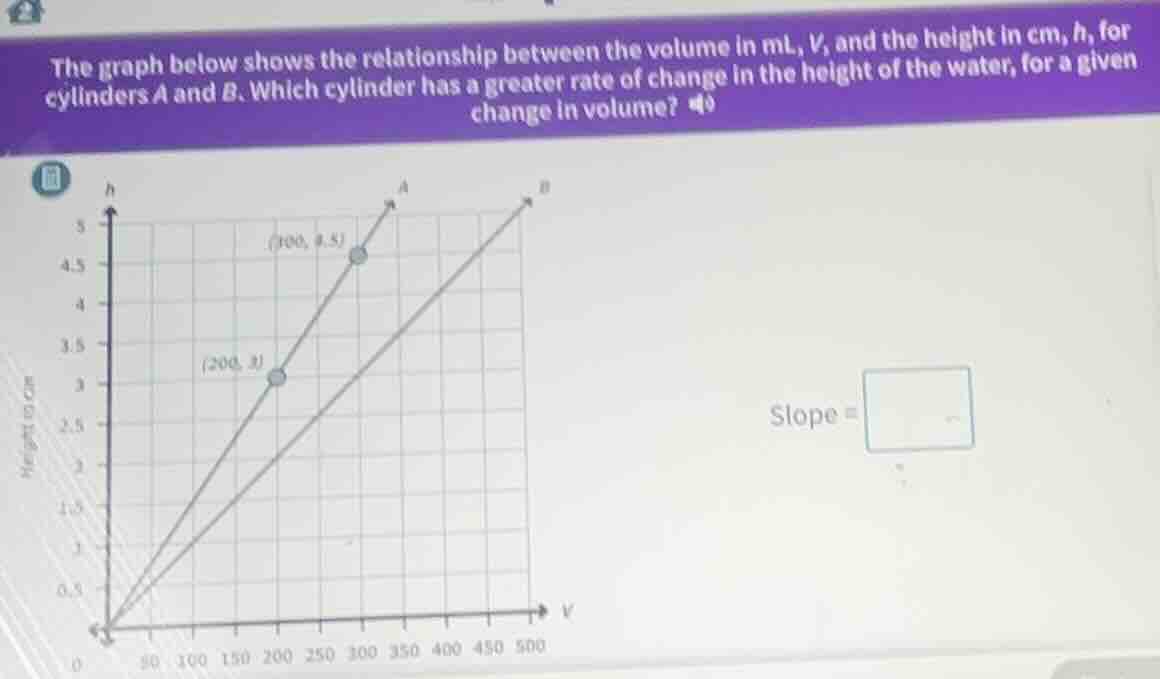
the graph below shows the relationship between the volume in ml, v, and the height in cm, h, for cylinders a and b. which cylinder has a greater rate of change in the height of the water, for a given change in volume?
slope =
Step1: Recall the slope formula
The slope \( m \) between two points \((x_1, y_1)\) and \((x_2, y_2)\) is given by \( m=\frac{y_2 - y_1}{x_2 - x_1} \). For the rate of change of height \( h \) with respect to volume \( V \), we use the points on each cylinder's line.
Step2: Calculate slope for Cylinder A
Using points \((200, 3)\) and \((300, 4.5)\) for Cylinder A:
\( m_A=\frac{4.5 - 3}{300 - 200}=\frac{1.5}{100}=0.015 \)
Step3: Calculate slope for Cylinder B (approximate a point, say when \( V = 500 \), assume \( h = 5 \) from the graph)
Using points \((0, 0)\) and \((500, 5)\) for Cylinder B:
\( m_B=\frac{5 - 0}{500 - 0}=\frac{5}{500}=0.01 \)
Step4: Compare slopes
Since \( 0.015>0.01 \), Cylinder A has a greater rate of change.

Snap & solve any problem in the app
Get step-by-step solutions on Sovi AI
Photo-based solutions with guided steps
Explore more problems and detailed explanations
Cylinder A has a greater rate of change. The slope for Cylinder A is \( 0.015 \) (cm/mL) and for Cylinder B is \( 0.01 \) (cm/mL), so Cylinder A's rate of change (slope) is greater.