QUESTION IMAGE
Question
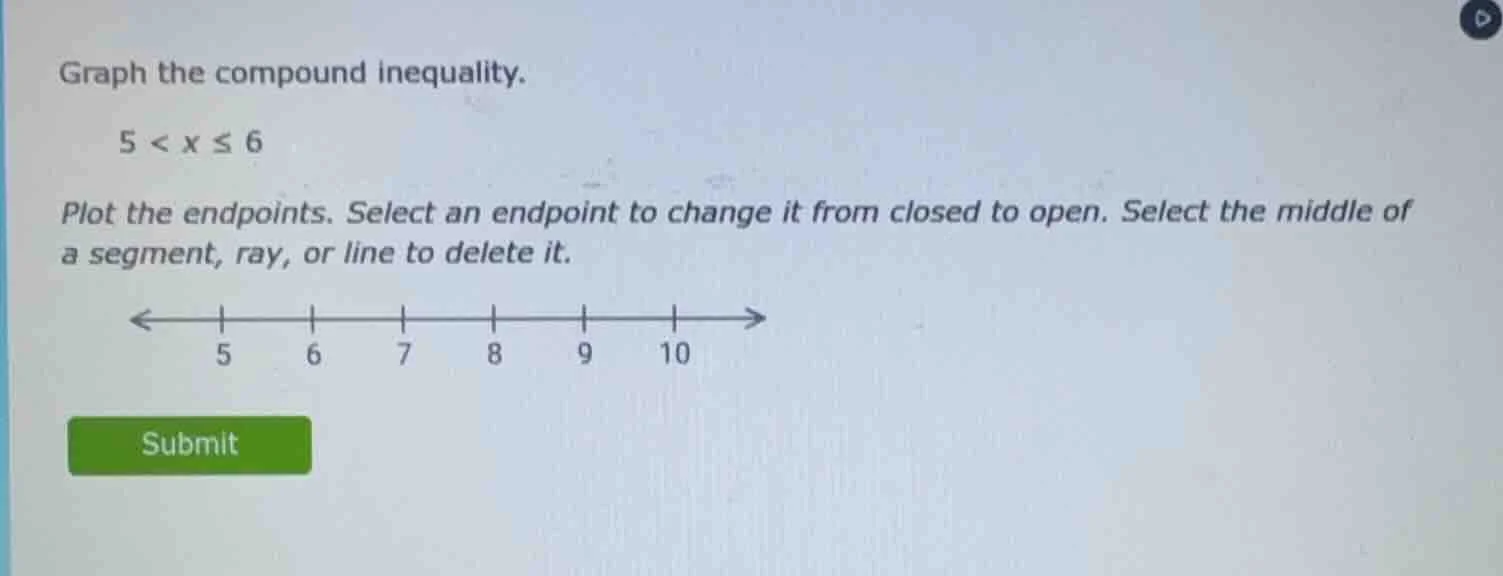
graph the compound inequality.
$5 < x \leq 6$
plot the endpoints. select an endpoint to change it from closed to open. select the middle of a segment, ray, or line to delete it.
submit
Step1: Identify inequality endpoints
The compound inequality is $5 < x \leq 6$, so endpoints are $x=5$ and $x=6$.
Step2: Mark endpoint types
- For $5 < x$: open circle at $x=5$ (since 5 is not included).
- For $x \leq 6$: closed circle at $x=6$ (since 6 is included).
Step3: Shade the segment
Shade the portion of the number line between $x=5$ and $x=6$.

Snap & solve any problem in the app
Get step-by-step solutions on Sovi AI
Photo-based solutions with guided steps
Explore more problems and detailed explanations
- Place an open circle at the point labeled 5 on the number line.
- Place a closed circle at the point labeled 6 on the number line.
- Shade the line segment connecting the open circle at 5 and the closed circle at 6.