QUESTION IMAGE
Question
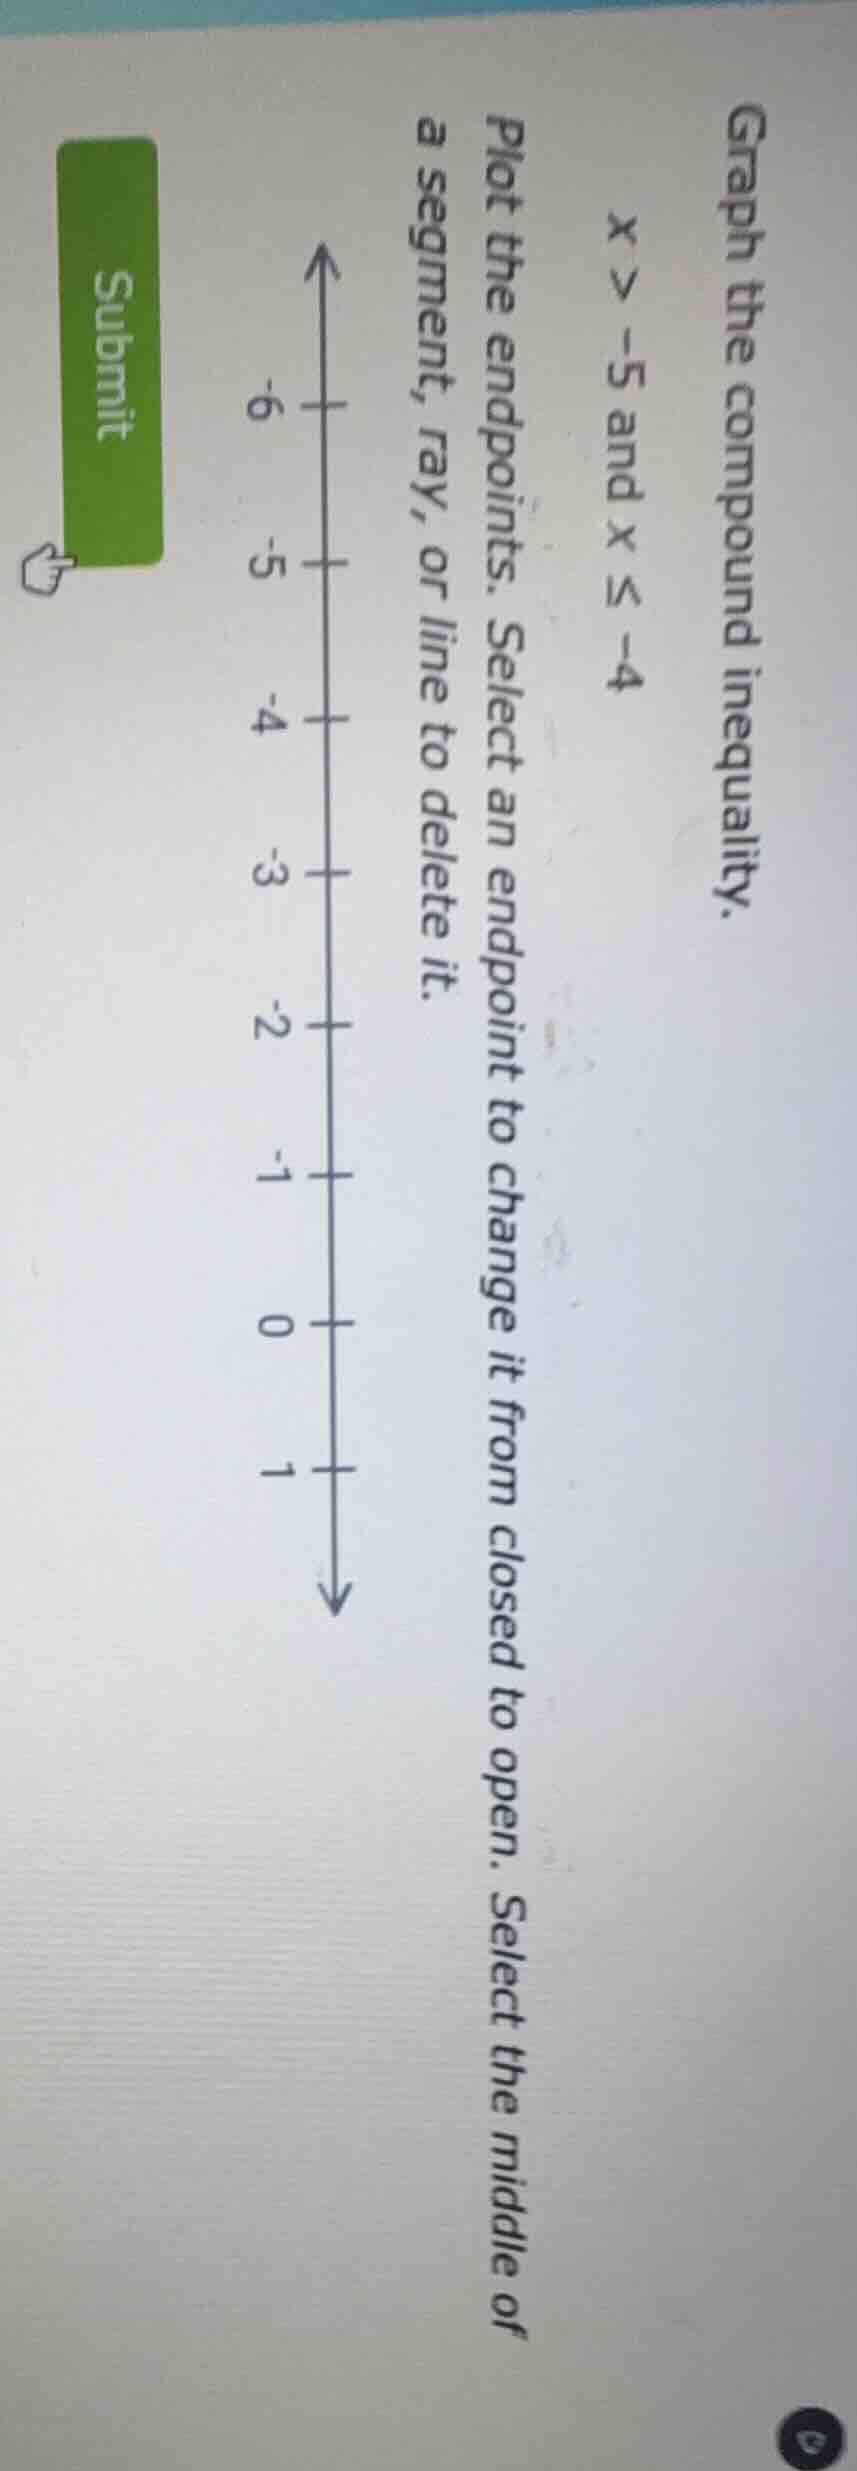
graph the compound inequality.
$x > -5$ and $x \leq -4$
plot the endpoints. select an endpoint to change it from closed to open. select the middle of a segment, ray, or line to delete it.
Step1: Identify endpoint for $x > -5$
At $x=-5$, use an open circle (since $x$ cannot equal $-5$).
Step2: Identify endpoint for $x \leq -4$
At $x=-4$, use a closed circle (since $x$ can equal $-4$).
Step3: Connect the endpoints
Draw a line segment between the open circle at $-5$ and closed circle at $-4$ to represent all values between them that satisfy both inequalities.

Snap & solve any problem in the app
Get step-by-step solutions on Sovi AI
Photo-based solutions with guided steps
Explore more problems and detailed explanations
- Place an open circle at $x = -5$ on the number line.
- Place a closed circle at $x = -4$ on the number line.
- Draw a solid line segment connecting the open circle at $-5$ and the closed circle at $-4$.