QUESTION IMAGE
Question
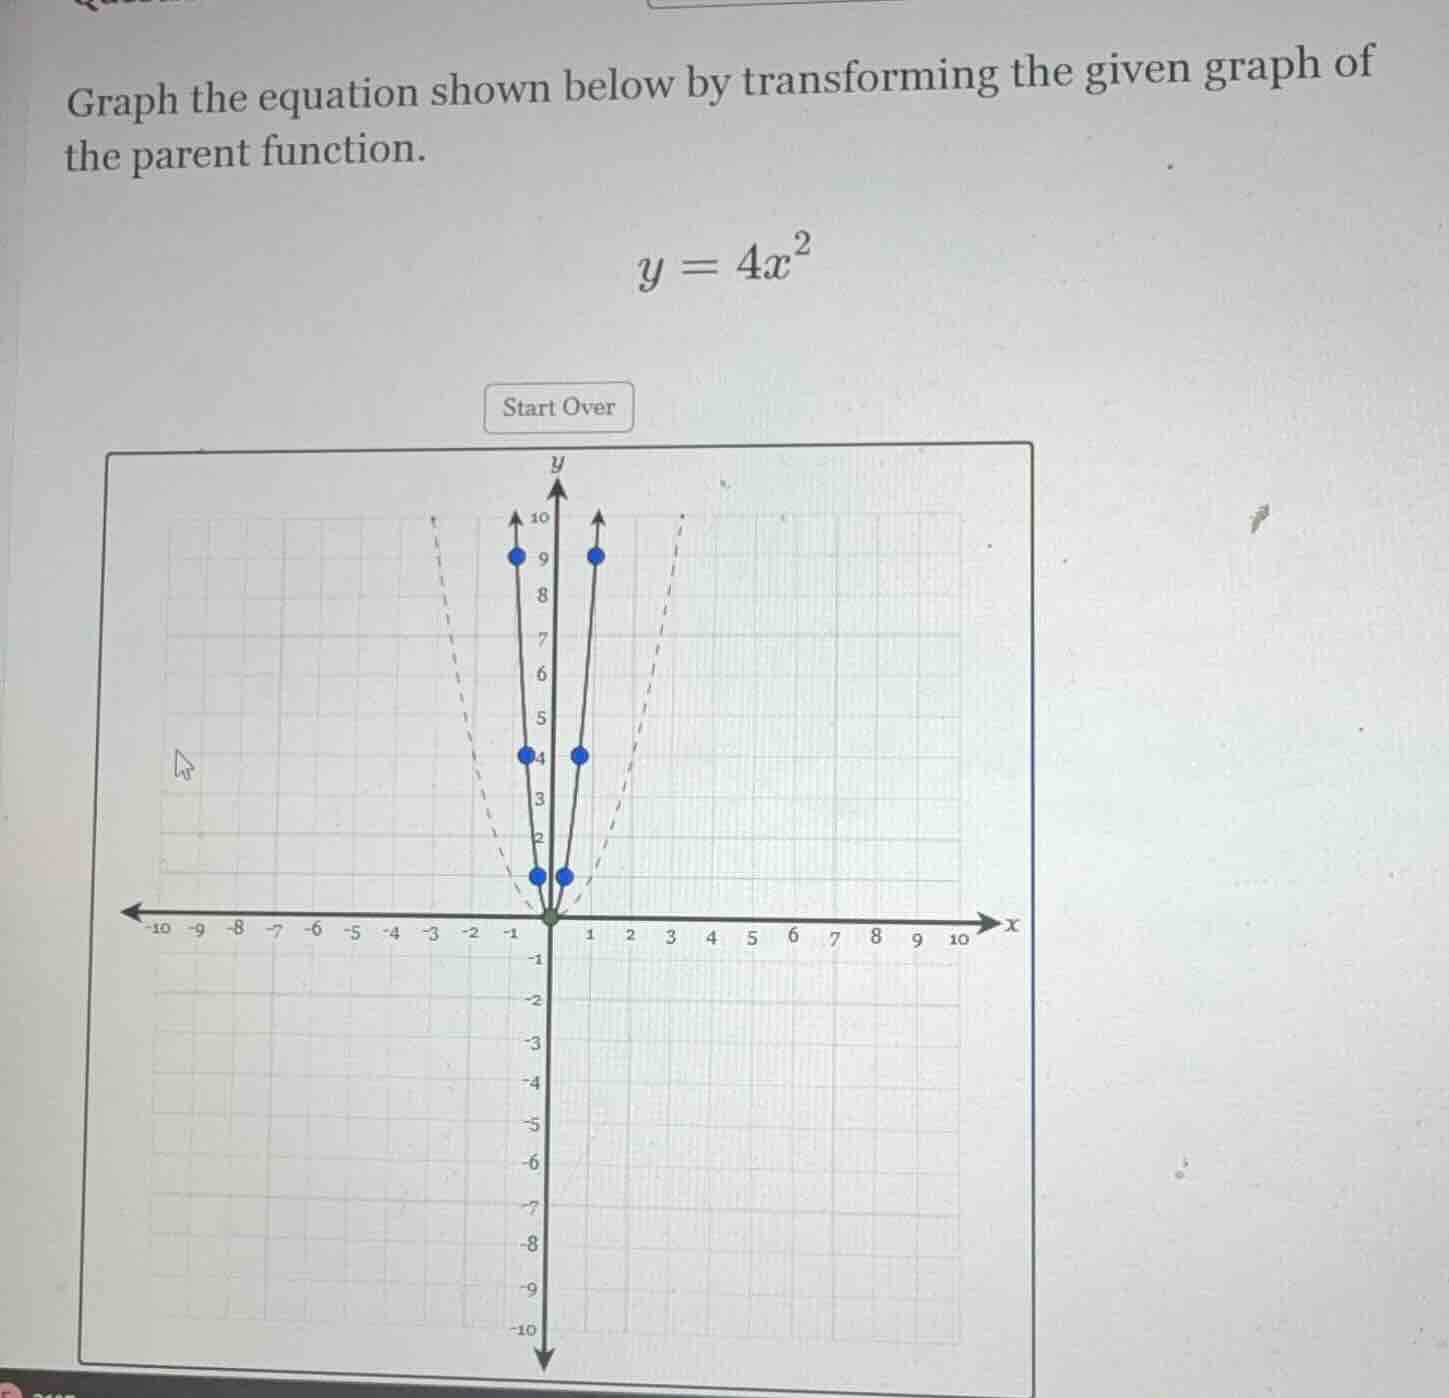
graph the equation shown below by transforming the given graph of the parent function.
y = 4x^2
Step1: Identify the parent function
The parent function for quadratic equations is \( y = x^2 \), which is a parabola opening upwards with vertex at the origin \((0,0)\).
Step2: Analyze the transformation
The given function is \( y = 4x^2 \). When we have a function of the form \( y = a x^2 \), the value of \( a \) affects the vertical stretch or compression of the parent function \( y = x^2 \). If \( |a|>1 \), the graph is vertically stretched by a factor of \( |a| \). Here, \( a = 4 \), so the graph of \( y = 4x^2 \) is a vertical stretch of the parent function \( y = x^2 \) by a factor of 4.
Step3: Determine key points
For the parent function \( y = x^2 \), some key points are \((-2,4)\), \((-1,1)\), \((0,0)\), \((1,1)\), \((2,4)\). For the transformed function \( y = 4x^2 \), we multiply the \( y \)-coordinates of these points by 4. So the new points become:
- For \( x=-2 \): \( y = 4\times(-2)^2=4\times4 = 16\)? Wait, no, wait. Wait, looking at the graph, the blue points are at \( x = -1, y = 4 \); \( x = 1, y = 4 \); \( x=-1, y = 1 \)? Wait, no, the graph shows that at \( x = -1 \) and \( x = 1 \), the \( y \)-value is 4 (since \( 4\times(1)^2=4 \)), and at \( x=-2 \) and \( x = 2 \), the \( y \)-value would be \( 4\times(2)^2 = 16 \), but in the given graph, the dashed lines (parent function) and solid lines (transformed) – wait, the parent function here (dashed) is \( y = x^2 \), so for \( x = 1 \), \( y = 1 \) (dashed), and for \( y = 4x^2 \), at \( x = 1 \), \( y = 4 \) (solid), at \( x = 2 \), \( y = 16 \) (but in the graph, maybe the grid is up to y=10, so maybe the key points shown are \( x=-1, y = 4 \); \( x = 1, y = 4 \); \( x = 0, y = 0 \); \( x=-2, y = 16 \) (but not shown), etc. But the main transformation is the vertical stretch.
Step4: Graph the transformed function
To graph \( y = 4x^2 \), we start with the vertex at \((0,0)\). Then, for \( x = 1 \), \( y = 4\times1^2=4 \), so we plot the point \((1,4)\). For \( x=-1 \), \( y = 4\times(-1)^2 = 4 \), so we plot \((-1,4)\). For \( x = 2 \), \( y = 4\times(2)^2=16 \), but if the graph has a limited range, we can plot the visible points. The graph will be a parabola opening upwards, narrower than the parent function \( y = x^2 \) (since it's stretched vertically), with vertex at the origin, passing through \((-1,4)\), \((1,4)\), \((-2,16)\), \((2,16)\) etc.

Snap & solve any problem in the app
Get step-by-step solutions on Sovi AI
Photo-based solutions with guided steps
Explore more problems and detailed explanations
To graph \( y = 4x^2 \), we vertically stretch the parent function \( y = x^2 \) by a factor of 4. The vertex remains at \((0,0)\), and key points like \((-1,4)\), \((1,4)\), \((-2,16)\), \((2,16)\) (and others) are plotted, resulting in a narrower parabola opening upwards compared to \( y = x^2 \).