QUESTION IMAGE
Question
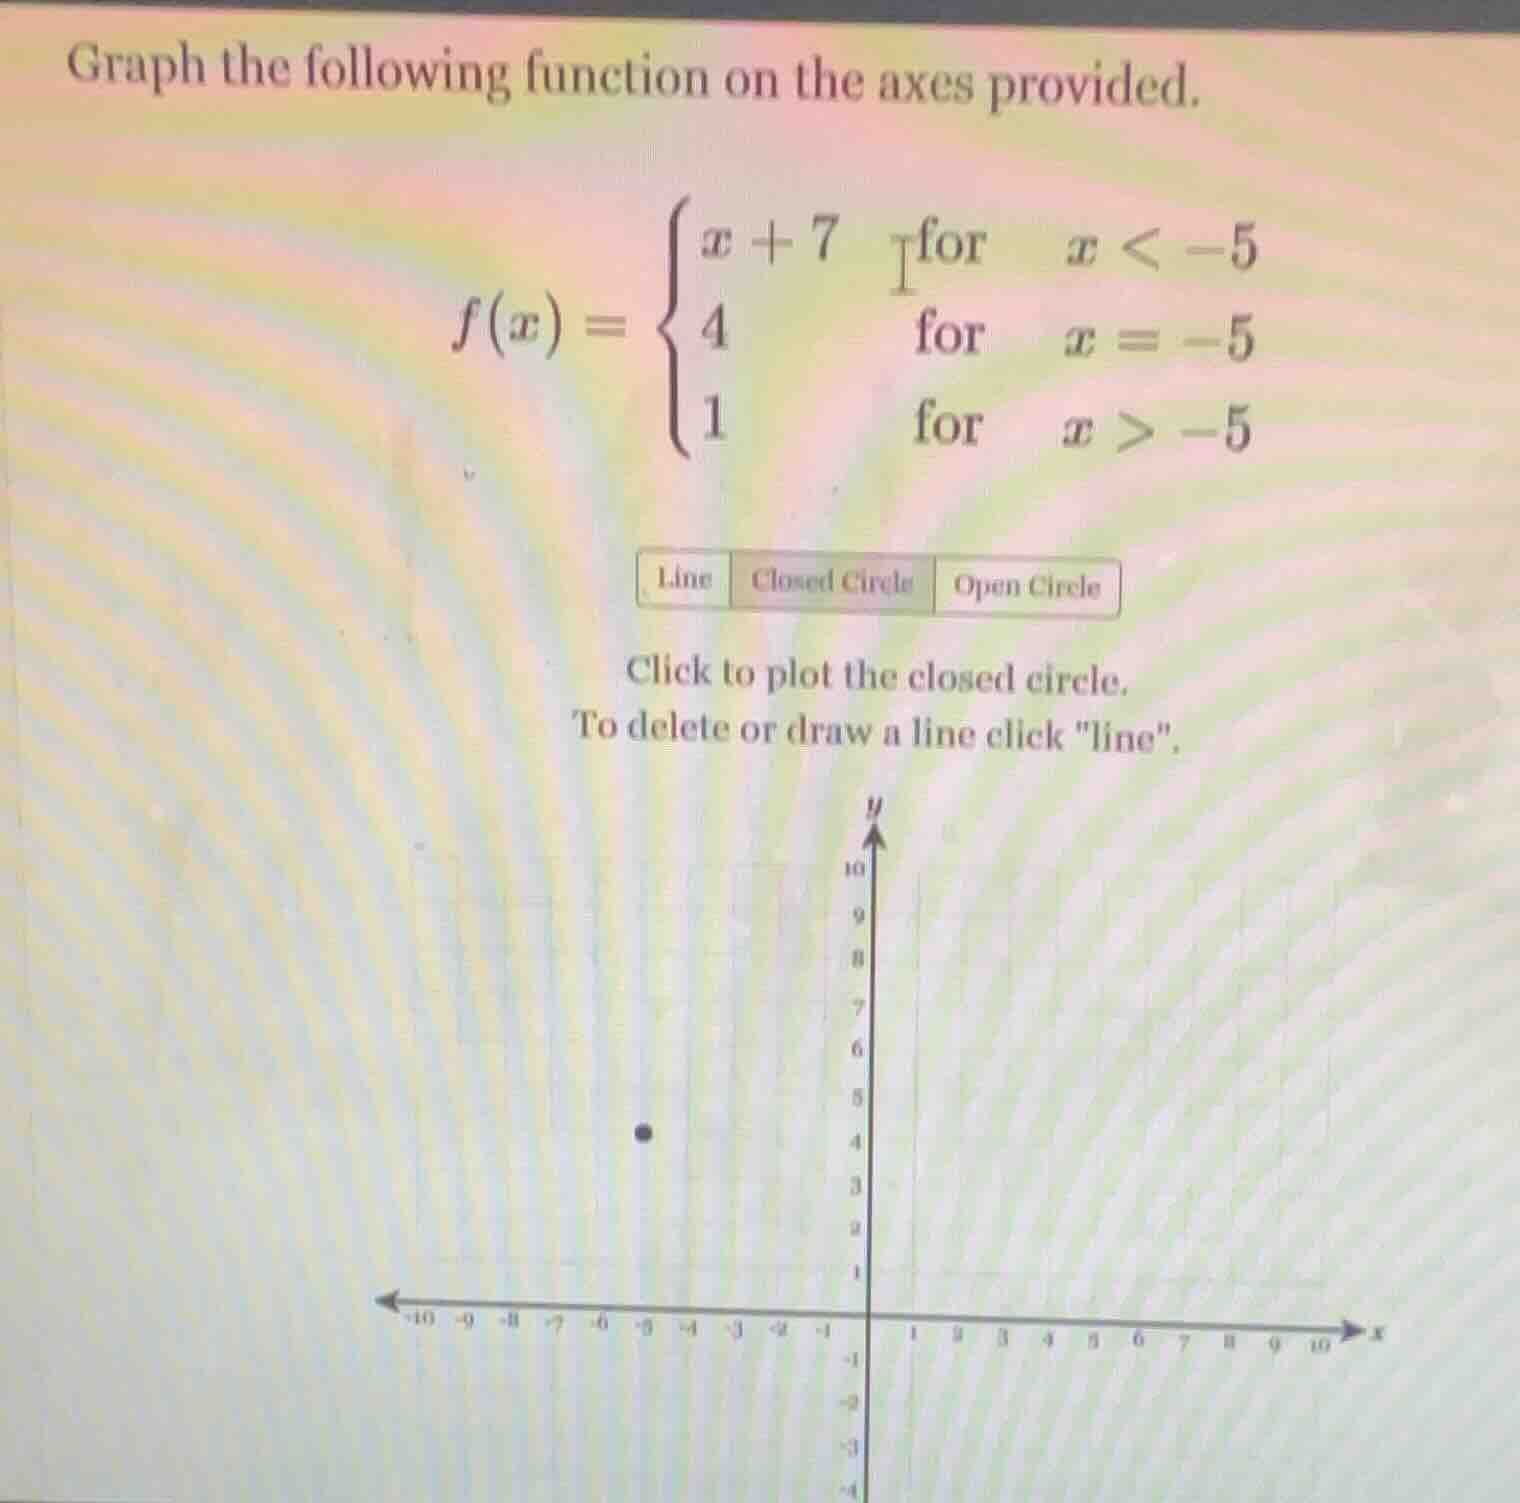
graph the following function on the axes provided.
$f(x) = \
$
line closed circle open circle
click to plot the closed circle.
to delete or draw a line click \line\.
graph axes with x from -10 to 10 and y from -4 to 10, with a dot plotted near (-5,4)
Step1: Graph $y=x+7$ for $x<-5$
First, find the point at $x=-5$: $y=-5+7=2$. Since $x<-5$ does not include $x=-5$, plot an open circle at $(-5, 2)$. Draw the line $y=x+7$ extending left from this open circle (for all $x$ values less than -5).
Step2: Plot the closed circle at $x=-5$
The function defines $f(-5)=4$, so plot a closed circle at the point $(-5, 4)$.
Step3: Graph $y=1$ for $x>-5$
For all $x$ greater than -5, $f(x)=1$. This is a horizontal line at $y=1$. At $x=-5$, since $x>-5$ does not include $x=-5$, plot an open circle at $(-5, 1)$, then draw the horizontal line extending right from this open circle (for all $x$ values greater than -5).

Snap & solve any problem in the app
Get step-by-step solutions on Sovi AI
Photo-based solutions with guided steps
Explore more problems and detailed explanations
The piecewise function is graphed as follows:
- A line representing $y=x+7$ for $x<-5$, with an open circle at $(-5, 2)$
- A closed circle at $(-5, 4)$
- A horizontal line $y=1$ for $x>-5$, with an open circle at $(-5, 1)$