QUESTION IMAGE
Question
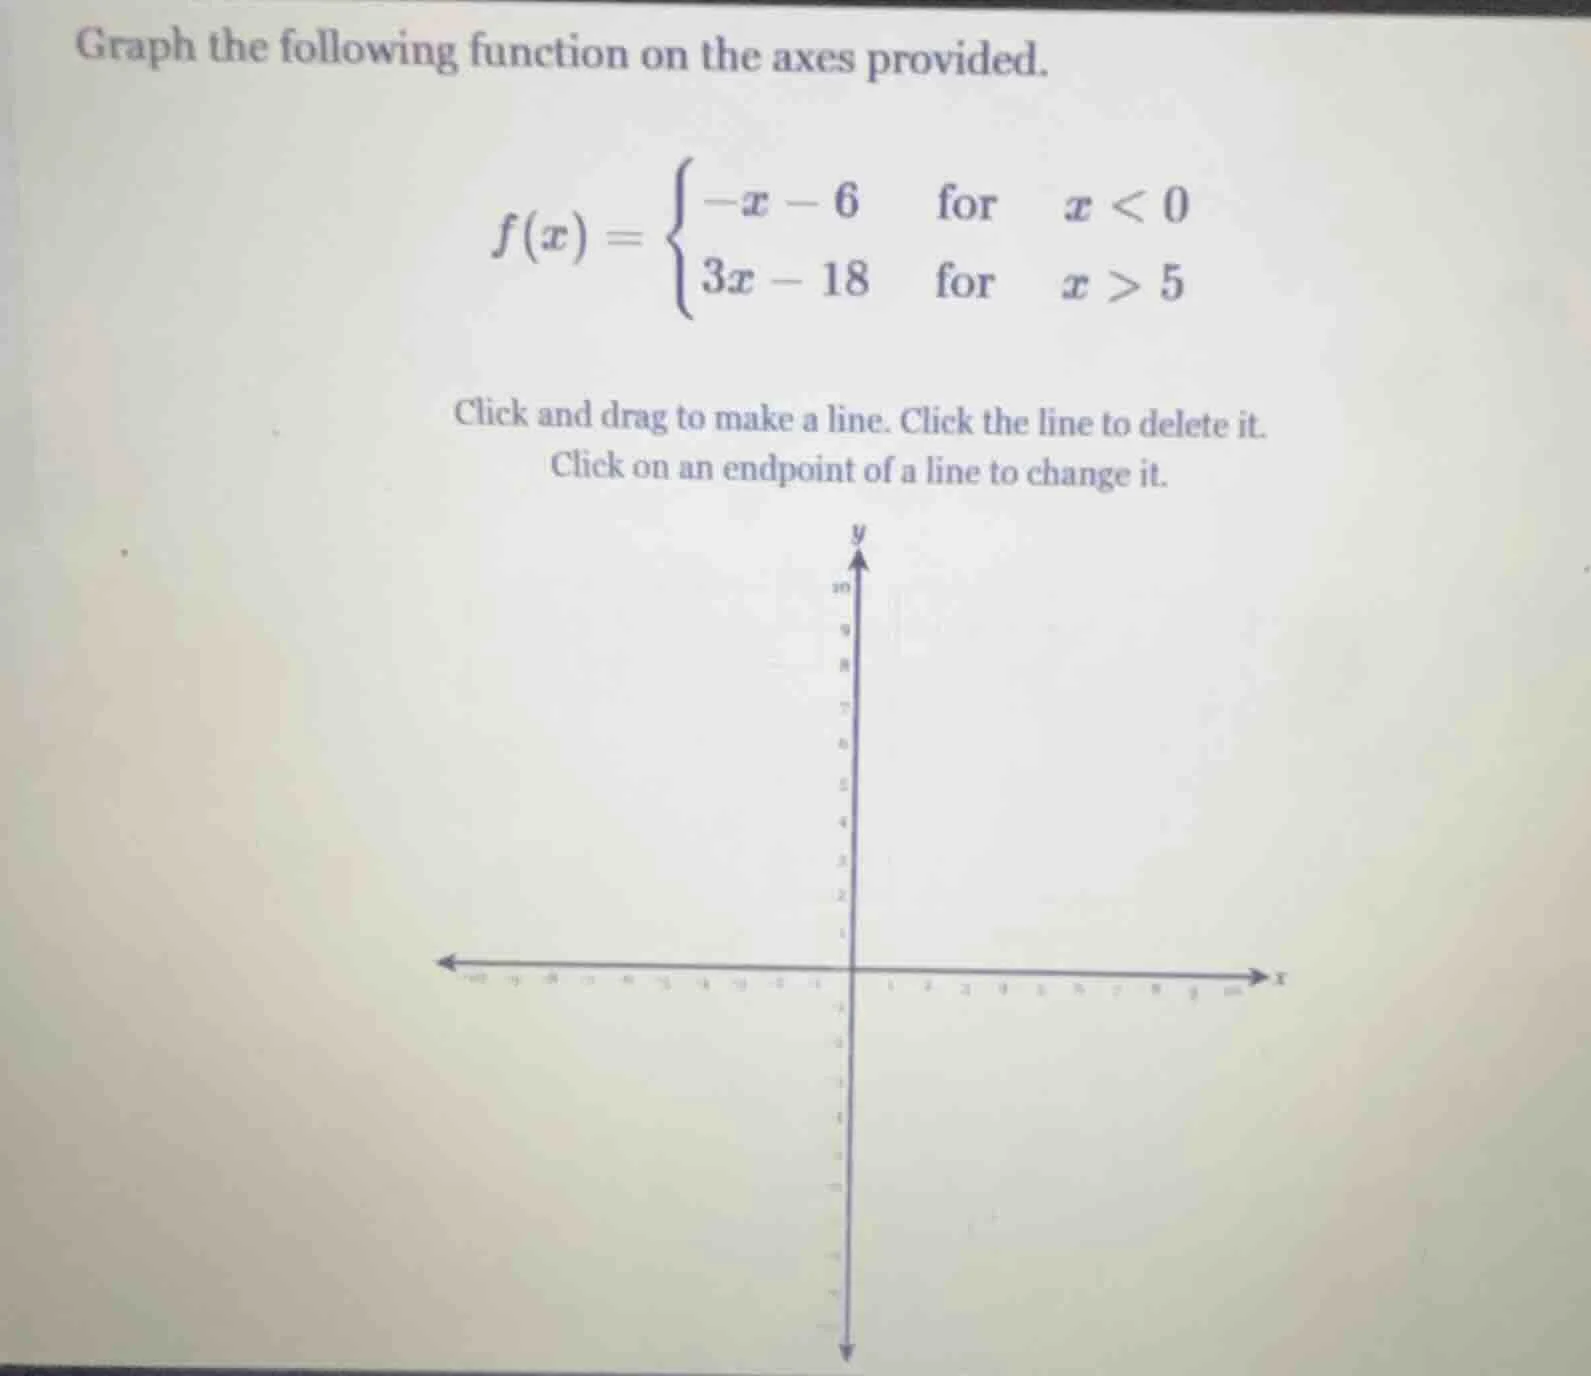
graph the following function on the axes provided.
$f(x) = \
$
click and drag to make a line. click the line to delete it.
click on an endpoint of a line to change it.
Step1: Analyze \( f(x) = -x - 6 \) (for \( x < 0 \))
This is a linear function with slope \( -1 \) and y - intercept \( -6 \). But since \( x < 0 \), we can find some points. When \( x = 0 \), \( f(0)=-0 - 6=-6 \), but since \( x < 0 \), the point \( (0, - 6) \) is an open circle (because the function is not defined at \( x = 0 \) for this part). Let's take \( x=-6 \), then \( f(-6)=-(-6)-6 = 6 - 6=0 \). So we have a line with slope - 1 passing through \( (-6,0) \) and approaching \( (0, - 6) \) (open circle).
Step2: Analyze \( f(x)=3x - 18 \) (for \( x > 5 \))
This is a linear function with slope \( 3 \). When \( x = 5 \), \( f(5)=3\times5-18 = 15 - 18=-3 \), but since \( x > 5 \), the point \( (5, - 3) \) is an open circle. Let's take \( x = 6 \), then \( f(6)=3\times6-18=18 - 18 = 0 \). So we have a line with slope 3 passing through \( (6,0) \) and approaching \( (5, - 3) \) (open circle).
To graph:
- For \( y=-x - 6, x < 0 \): Plot the open circle at \( (0,-6) \), then use the slope - 1 (down 1, right 1 or up 1, left 1) to draw the line for \( x < 0 \). For example, from \( (0,-6) \) (open), moving left (since \( x < 0 \)): when \( x=-1 \), \( y=-(-1)-6=1 - 6=-5 \), so the point \( (-1,-5) \); when \( x = - 6 \), \( y = 0 \) as calculated before.
- For \( y = 3x-18, x > 5 \): Plot the open circle at \( (5,-3) \), then use the slope 3 (up 3, right 1) to draw the line for \( x > 5 \). For example, when \( x = 6 \), \( y = 0 \); when \( x=7 \), \( y=3\times7 - 18=21 - 18 = 3 \), so the point \( (7,3) \).
(Note: Since this is a graphing problem, the final answer is the graph constructed by the two lines as described above. The first line (for \( x < 0 \)) has a slope of - 1, passes through points like \( (-6,0) \) and approaches \( (0, - 6) \) (open circle). The second line (for \( x > 5 \)) has a slope of 3, passes through points like \( (6,0) \) and approaches \( (5, - 3) \) (open circle).)

Snap & solve any problem in the app
Get step-by-step solutions on Sovi AI
Photo-based solutions with guided steps
Explore more problems and detailed explanations
The graph consists of two lines:
- A line with slope - 1 for \( x < 0 \), passing through \( (-6,0) \) and having an open circle at \( (0, - 6) \).
- A line with slope 3 for \( x > 5 \), passing through \( (6,0) \) and having an open circle at \( (5, - 3) \).