QUESTION IMAGE
Question
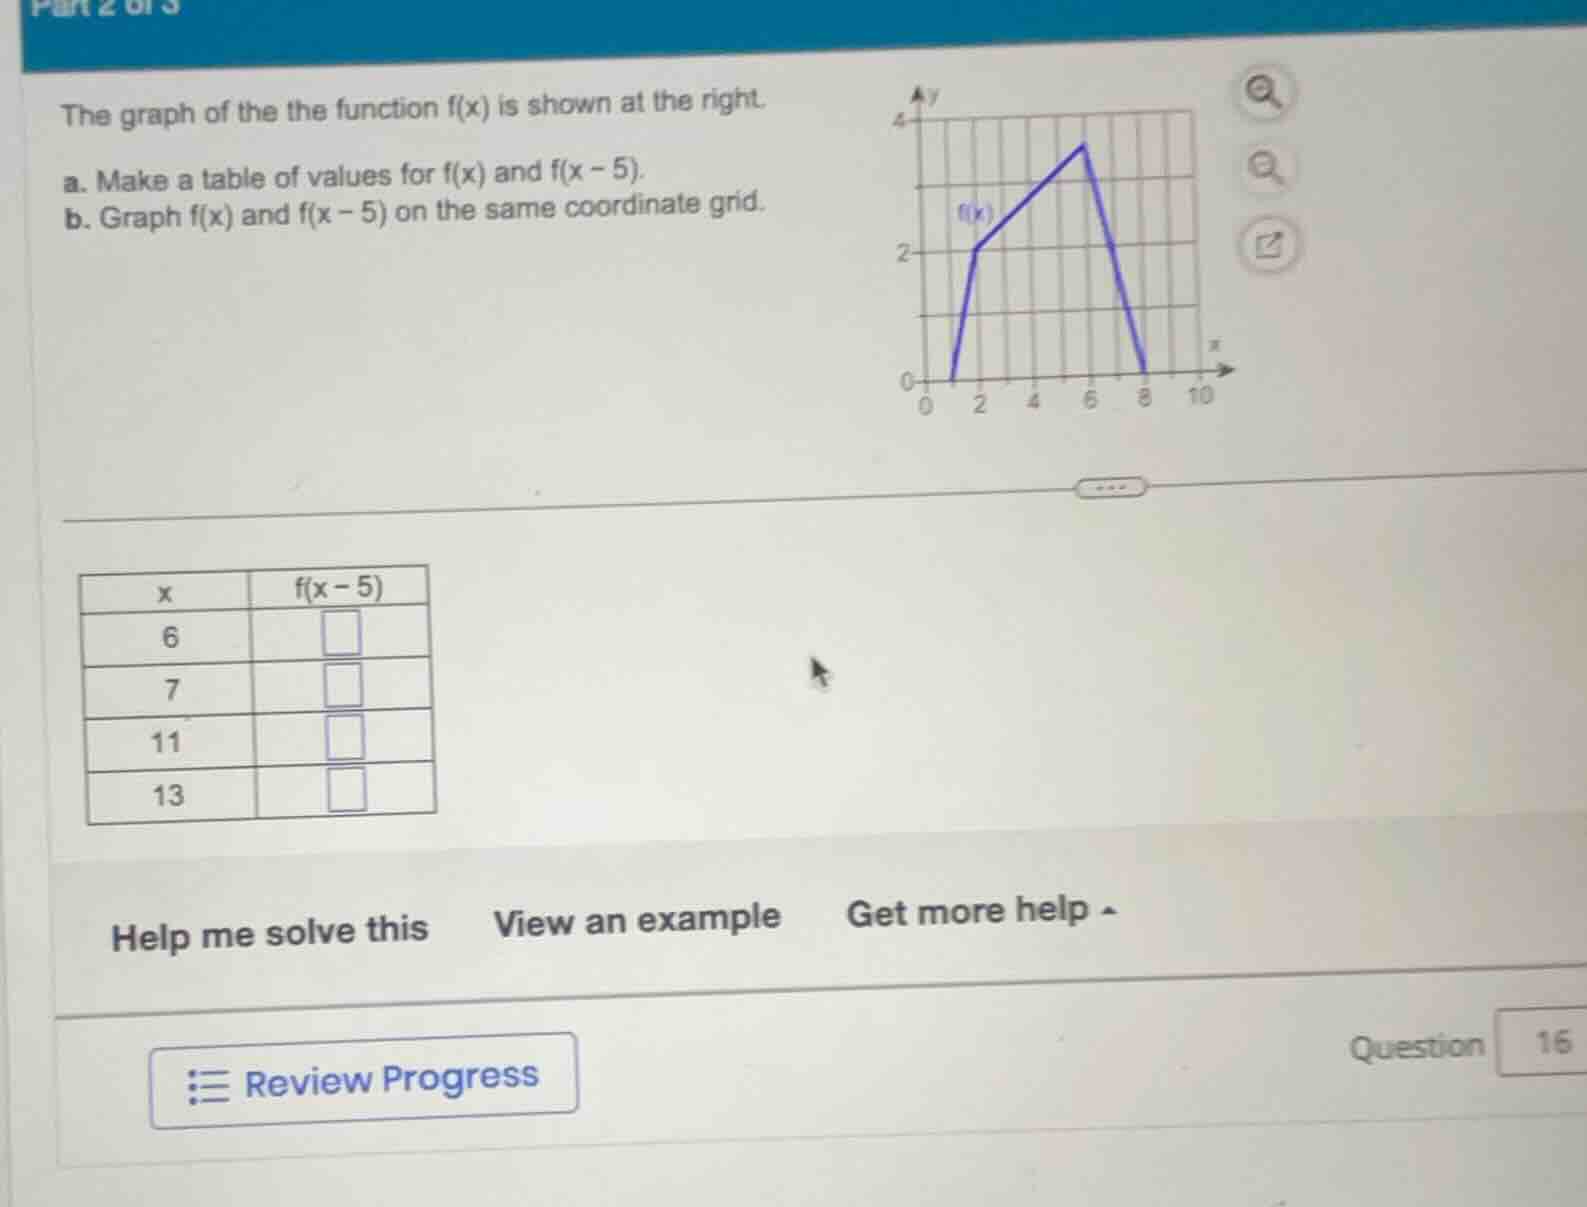
the graph of the the function f(x) is shown at the right.
a. make a table of values for f(x) and f(x - 5).
b. graph f(x) and f(x - 5) on the same coordinate grid.
(table with x values 6,7,11,13 and f(x - 5) columns with empty boxes)
Step1: Analyze \( f(x - 5) \) for \( x = 6 \)
To find \( f(6 - 5) = f(1) \). From the graph, at \( x = 1 \), we observe the value (assuming the graph starts rising from \( x = 0 \) to \( x = 2 \), at \( x = 1 \), let's see the trend. Wait, actually, let's first get the key points of \( f(x) \). From the graph, the function \( f(x) \) has points: at \( x = 1 \), maybe \( y = 0 \) (since it starts at \( (1,0) \)? Wait, the graph starts at \( x = 1 \), \( y = 0 \), then at \( x = 2 \), \( y = 2 \), then rises to \( x = 6 \), \( y = 4 \), then falls to \( x = 8 \), \( y = 0 \). Wait, let's re - examine the graph:
Looking at the graph, the x - axis has ticks at 0, 2, 4, 6, 8, 10. The function \( f(x) \):
- At \( x = 1 \), \( f(1)=0 \) (starts near \( x = 1 \), \( y = 0 \))
- At \( x = 2 \), \( f(2)=2 \)
- At \( x = 6 \), \( f(6)=4 \)
- At \( x = 8 \), \( f(8)=0 \)
For \( x = 6 \), \( f(x - 5)=f(6 - 5)=f(1) \). From the graph, when \( x = 1 \), \( f(1)=0 \)? Wait, no, maybe I misread. Wait, the graph starts at \( x = 1 \)? Wait, the left - most point is at \( x = 1 \), \( y = 0 \), then at \( x = 2 \), \( y = 2 \), then it goes up to \( x = 6 \), \( y = 4 \), then down to \( x = 8 \), \( y = 0 \).
So for \( x = 6 \): \( f(6 - 5)=f(1) \). Wait, maybe the domain of \( f(x) \) is from \( x = 1 \) to \( x = 8 \)? Wait, no, the graph is drawn from \( x = 1 \) (where \( y = 0 \)) to \( x = 8 \) (where \( y = 0 \)), with a peak at \( x = 6 \), \( y = 4 \), and at \( x = 2 \), \( y = 2 \).
Wait, let's correct:
Let's list the key points of \( f(x) \):
- When \( x = 1 \), \( f(1)=0 \)
- When \( x = 2 \), \( f(2)=2 \)
- When \( x = 6 \), \( f(6)=4 \)
- When \( x = 8 \), \( f(8)=0 \)
Now, for \( f(x - 5) \), we substitute \( x-5\) into \( f \).
Step 1: For \( x = 6 \)
\( f(6 - 5)=f(1) \). From the graph, when \( x = 1 \), \( f(1)=0 \)? Wait, no, maybe the starting point is \( x = 1 \), \( y = 0 \), then at \( x = 2 \), \( y = 2 \), so \( f(1)=0 \), \( f(2)=2 \), \( f(6)=4 \), \( f(8)=0 \).
Wait, maybe I made a mistake. Let's try another approach. The transformation \( f(x-5) \) is a horizontal shift of \( f(x) \) to the right by 5 units. So the graph of \( f(x - 5) \) is the graph of \( f(x) \) shifted 5 units to the right.
So the original \( f(x) \) has:
- A "start" at \( x = 1 \), \( y = 0 \)
- A point at \( x = 2 \), \( y = 2 \)
- A peak at \( x = 6 \), \( y = 4 \)
- An "end" at \( x = 8 \), \( y = 0 \)
After shifting right by 5 units, the new function \( f(x - 5) \) will have:
- The "start" at \( x=1 + 5=6 \), \( y = 0 \)
- The point at \( x = 2+5 = 7 \), \( y = 2 \)
- The peak at \( x=6 + 5=11 \), \( y = 4 \)
- The "end" at \( x = 8+5=13 \), \( y = 0 \)
Ah! That makes more sense. So the transformation \( f(x-5) \) is a horizontal shift right by 5 units. So:
- When \( x = 6 \), \( f(x - 5)=f(6 - 5)=f(1) \), but using the shift idea, the point \( (1,0) \) on \( f(x) \) shifts to \( (1 + 5,0)=(6,0) \), so \( f(6 - 5)=f(1)=0 \)? Wait, no, if we shift the graph of \( f(x) \) 5 units to the right to get \( f(x - 5) \), then the point \( (a,b) \) on \( f(x) \) corresponds to the point \( (a + 5,b) \) on \( f(x - 5) \). So to find \( f(x-5) \) at \( x \), we can think of \( x-5=a \), so \( x=a + 5 \), and \( f(x-5)=f(a) \).
So for \( x = 6 \):
We want to find \( f(6-5)=f(1) \). From the graph of \( f(x) \), when \( x = 1 \), what is \( f(1) \)? Looking at the graph, at \( x = 1 \), \( y = 0 \) (the left - most point of \( f(x) \) is at \( (1,0) \)). So \( f(1)=0 \), so \( f(6 - 5)=0 \).
Step 2: For \( x = 7 \)
\( f(7-5)=f(2) \). Fr…

Snap & solve any problem in the app
Get step-by-step solutions on Sovi AI
Photo-based solutions with guided steps
Explore more problems and detailed explanations
For \( x = 6 \), \( f(x - 5)=\boldsymbol{0} \); for \( x = 7 \), \( f(x - 5)=\boldsymbol{2} \); for \( x = 11 \), \( f(x - 5)=\boldsymbol{4} \); for \( x = 13 \), \( f(x - 5)=\boldsymbol{0} \)
So the table values are:
| \( x \) | \( f(x - 5) \) |
|---|---|
| 7 | 2 |
| 11 | 4 |
| 13 | 0 |