QUESTION IMAGE
Question
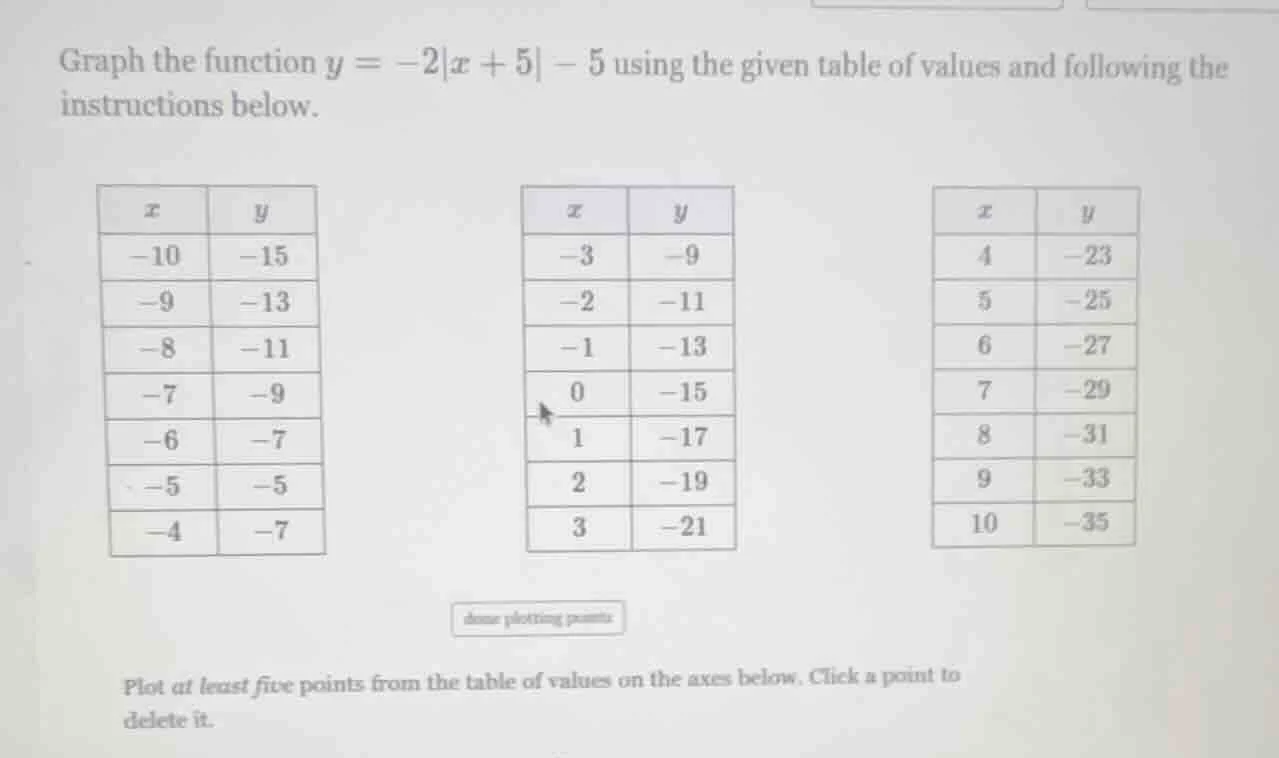
graph the function $y = -2|x + 5| - 5$ using the given table of values and following the instructions below.
| $x$ | $y$ |
|---|---|
| $-9$ | $-13$ |
| $-8$ | $-11$ |
| $-7$ | $-9$ |
| $-6$ | $-7$ |
| $-5$ | $-5$ |
| $-4$ | $-7$ |
| $x$ | $y$ |
|---|---|
| $-2$ | $-11$ |
| $-1$ | $-13$ |
| $0$ | $-15$ |
| $1$ | $-17$ |
| $2$ | $-19$ |
| $3$ | $-21$ |
| $x$ | $y$ |
|---|---|
| $5$ | $-25$ |
| $6$ | $-27$ |
| $7$ | $-29$ |
| $8$ | $-31$ |
| $9$ | $-33$ |
| $10$ | $-35$ |
done plotting points
plot at least five points from the table of values on the axes below. click a point to delete it.
Step1: Recall the function
The function is \( y = -2|x + 5| - 5 \). This is an absolute - value function. The general form of an absolute - value function is \( y=a|x - h|+k \), where \((h,k)\) is the vertex of the V - shaped graph. For our function \( y=-2|x + 5|-5=-2|x-(-5)|+(-5) \), the vertex is at \((-5,-5)\).
Step2: Select points to plot
We can choose points from the given tables. Let's pick the following points:
- When \( x=-5 \), \( y=-5 \) (this is the vertex).
- When \( x=-6 \), substitute \( x = - 6\) into the function: \( y=-2|-6 + 5|-5=-2|-1|-5=-2\times1-5=-7 \) (matches the table).
- When \( x=-4 \), substitute \( x=-4\) into the function: \( y=-2|-4 + 5|-5=-2|1|-5=-2 - 5=-7 \) (matches the table).
- When \( x=-7 \), substitute \( x=-7\) into the function: \( y=-2|-7 + 5|-5=-2|-2|-5=-4 - 5=-9 \) (matches the table).
- When \( x=-3 \), substitute \( x=-3\) into the function: \( y=-2|-3 + 5|-5=-2|2|-5=-4 - 5=-9 \) (matches the table).
To plot the points:
- Locate the point \((-5,-5)\) on the coordinate plane (the vertex, where the graph changes direction).
- Locate \((-6,-7)\): move 6 units to the left of the origin on the x - axis and 7 units down on the y - axis.
- Locate \((-4,-7)\): move 4 units to the left of the origin on the x - axis and 7 units down on the y - axis.
- Locate \((-7,-9)\): move 7 units to the left of the origin on the x - axis and 9 units down on the y - axis.
- Locate \((-3,-9)\): move 3 units to the left of the origin on the x - axis and 9 units down on the y - axis.
After plotting these points, we can see that the graph is a downward - opening V - shape (because \( a=-2<0 \)) with the vertex at \((-5,-5)\) and symmetric about the vertical line \( x=-5 \).

Snap & solve any problem in the app
Get step-by-step solutions on Sovi AI
Photo-based solutions with guided steps
Explore more problems and detailed explanations
To graph the function \( y = - 2|x + 5|-5\), plot the points (at least five) such as \((-5,-5)\), \((-6,-7)\), \((-4,-7)\), \((-7,-9)\), \((-3,-9)\) on the coordinate plane. The graph is a downward - opening V - shaped graph with vertex at \((-5,-5)\) and symmetric about \( x=-5 \).