QUESTION IMAGE
Question
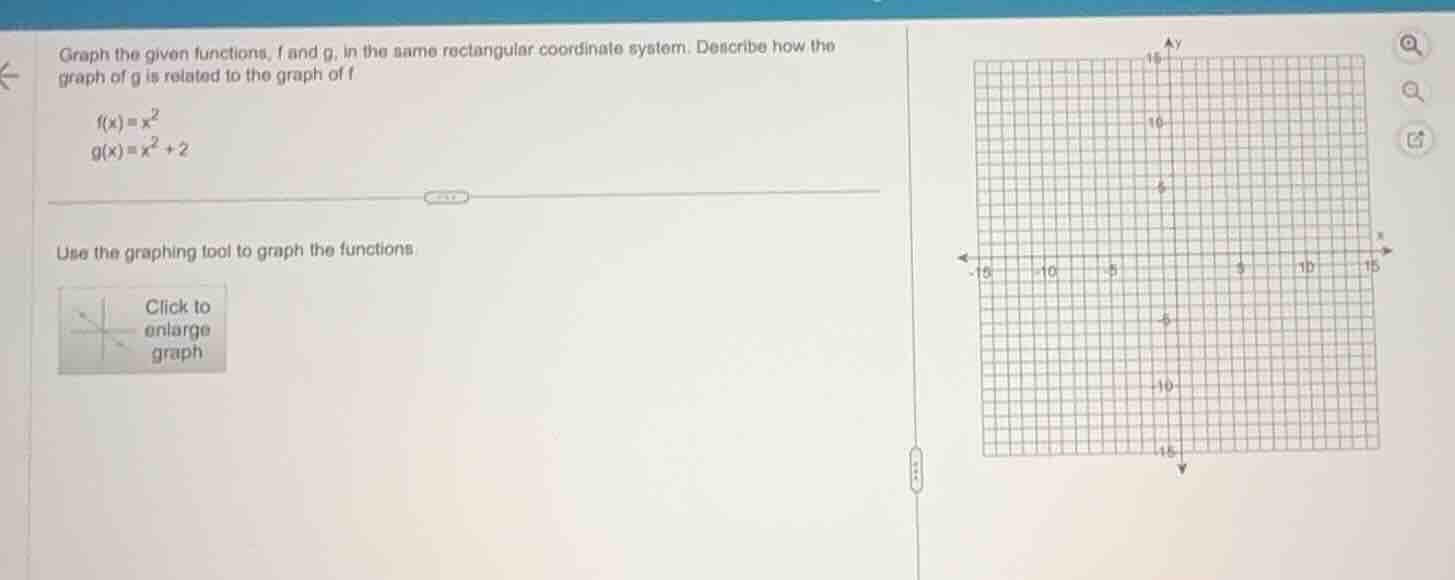
graph the given functions, f and g, in the same rectangular coordinate system. describe how the graph of g is related to the graph of f
$f(x)=x^{2}$
$g(x)=x^{2}+2$
use the graphing tool to graph the functions.
click to enlarge graph
Step1: Identify parent function
$f(x) = x^2$ is a standard parabola with vertex at $(0,0)$. Key points:
$(-2, 4), (-1, 1), (0, 0), (1, 1), (2, 4)$
Step2: Transform to find $g(x)$ points
$g(x) = x^2 + 2$ adds 2 to each $f(x)$ value. Key points:
$(-2, 4+2)=(-2,6), (-1,1+2)=(-1,3), (0,0+2)=(0,2), (1,1+2)=(1,3), (2,4+2)=(2,6)$
Step3: Relate graphs vertically
$g(x) = f(x) + 2$ shifts $f(x)$ up.

Snap & solve any problem in the app
Get step-by-step solutions on Sovi AI
Photo-based solutions with guided steps
Explore more problems and detailed explanations
- The graph of $g(x)$ is the graph of $f(x) = x^2$ shifted 2 units upward (vertex moves from $(0,0)$ to $(0,2)$, and all corresponding points on $f(x)$ are moved up by 2 units).
- To graph:
- Plot the parabola for $f(x) = x^2$ using points $(-2,4), (-1,1), (0,0), (1,1), (2,4)$ and draw a smooth curve.
- Plot the parabola for $g(x) = x^2 + 2$ using points $(-2,6), (-1,3), (0,2), (1,3), (2,6)$ and draw a smooth curve.