QUESTION IMAGE
Question
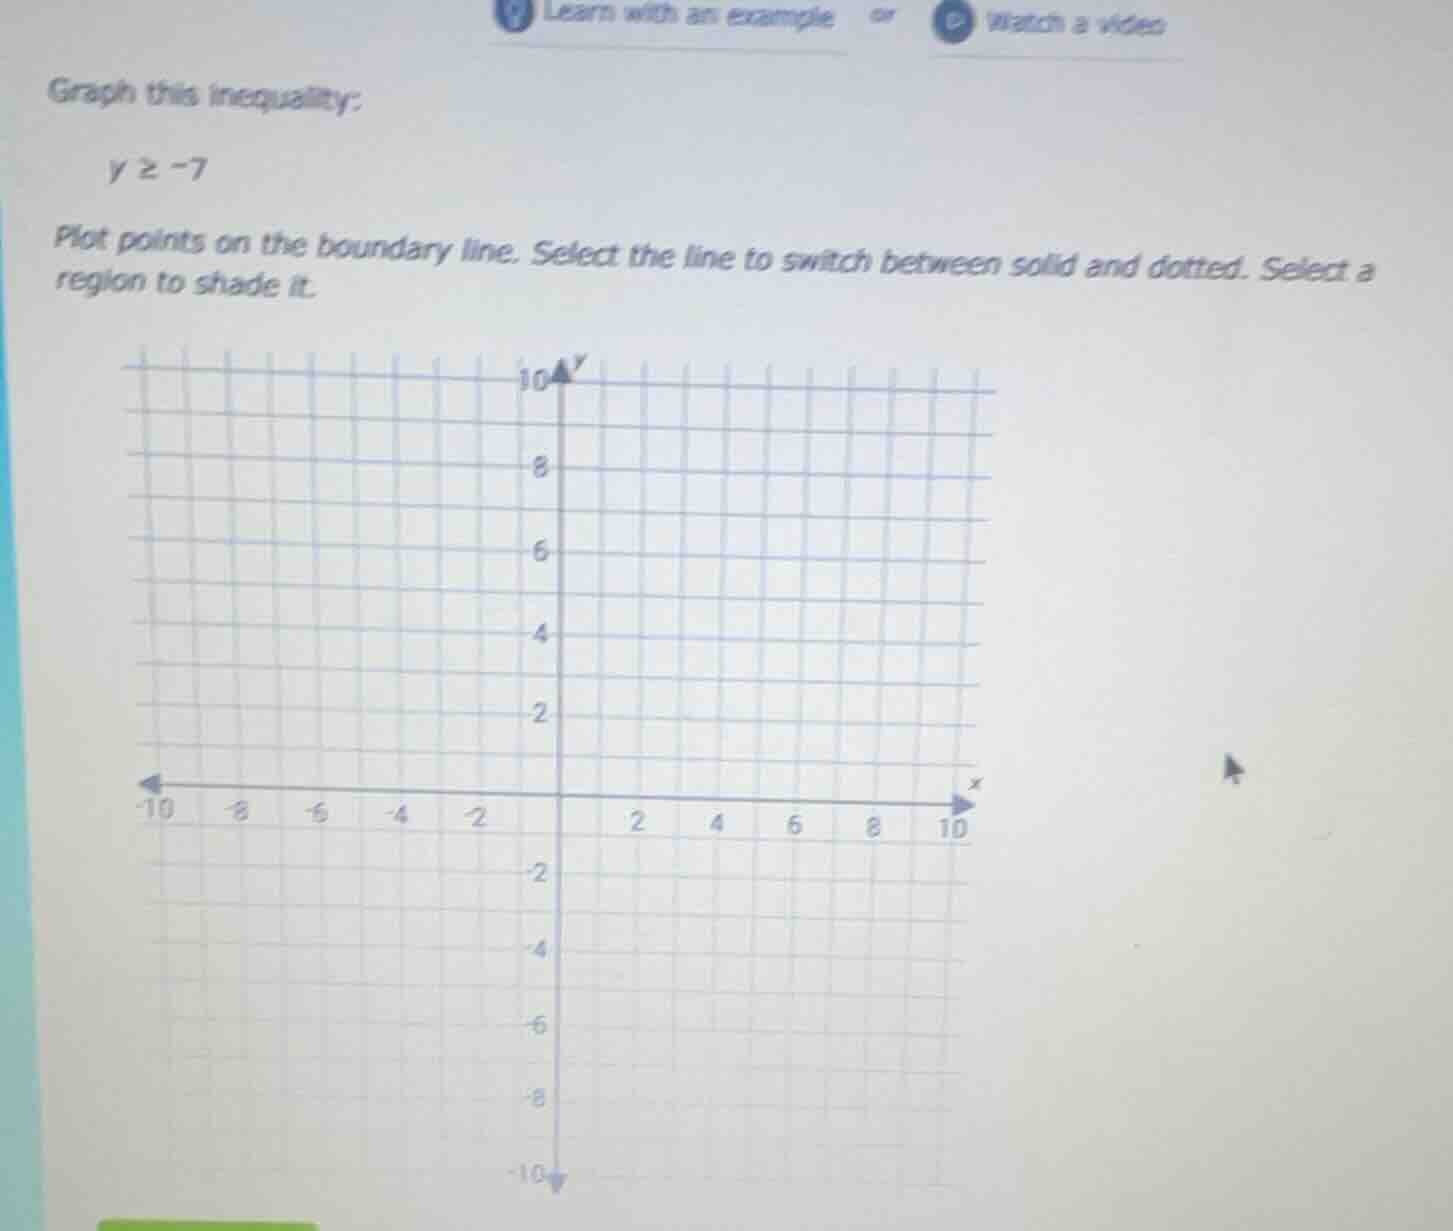
graph this inequality:
y ≥ -7
plot points on the boundary line. select the line to switch between solid and dotted. select a region to shade it.
Step1: Identify the boundary line
The inequality is \( y \geq -7 \). The boundary line is \( y = -7 \), which is a horizontal line (since the equation is in terms of \( y \) and has no \( x \) term). A horizontal line \( y = k \) has a slope of 0 and passes through all points where the \( y \)-coordinate is \( k \). For \( y = -7 \), we can plot points like \( (0, -7) \), \( (1, -7) \), \( (-1, -7) \), etc. Since the inequality is \( \geq \), the boundary line should be solid (because the inequality includes the equal case).
Step2: Determine the region to shade
To find which side of the line \( y = -7 \) to shade, we can test a point not on the line. A common test point is the origin \( (0, 0) \). Substitute \( x = 0 \) and \( y = 0 \) into the inequality \( y \geq -7 \): \( 0 \geq -7 \), which is true. So the region containing the origin (the region above the line \( y = -7 \)) should be shaded.
To graph \( y \geq -7 \):
- Draw a solid horizontal line at \( y = -7 \) (passing through points like \( (0, -7) \), \( (2, -7) \), \( (-3, -7) \), etc.).
- Shade the region above the line \( y = -7 \) (since the test point \( (0, 0) \) satisfies the inequality and is above \( y = -7 \)).
(Note: Since this is a graphing task, the final answer is the described graph. If we were to represent it textually, the key elements are the solid line at \( y = -7 \) and shading above it.)

Snap & solve any problem in the app
Get step-by-step solutions on Sovi AI
Photo-based solutions with guided steps
Explore more problems and detailed explanations
Step1: Identify the boundary line
The inequality is \( y \geq -7 \). The boundary line is \( y = -7 \), which is a horizontal line (since the equation is in terms of \( y \) and has no \( x \) term). A horizontal line \( y = k \) has a slope of 0 and passes through all points where the \( y \)-coordinate is \( k \). For \( y = -7 \), we can plot points like \( (0, -7) \), \( (1, -7) \), \( (-1, -7) \), etc. Since the inequality is \( \geq \), the boundary line should be solid (because the inequality includes the equal case).
Step2: Determine the region to shade
To find which side of the line \( y = -7 \) to shade, we can test a point not on the line. A common test point is the origin \( (0, 0) \). Substitute \( x = 0 \) and \( y = 0 \) into the inequality \( y \geq -7 \): \( 0 \geq -7 \), which is true. So the region containing the origin (the region above the line \( y = -7 \)) should be shaded.
To graph \( y \geq -7 \):
- Draw a solid horizontal line at \( y = -7 \) (passing through points like \( (0, -7) \), \( (2, -7) \), \( (-3, -7) \), etc.).
- Shade the region above the line \( y = -7 \) (since the test point \( (0, 0) \) satisfies the inequality and is above \( y = -7 \)).
(Note: Since this is a graphing task, the final answer is the described graph. If we were to represent it textually, the key elements are the solid line at \( y = -7 \) and shading above it.)