QUESTION IMAGE
Question
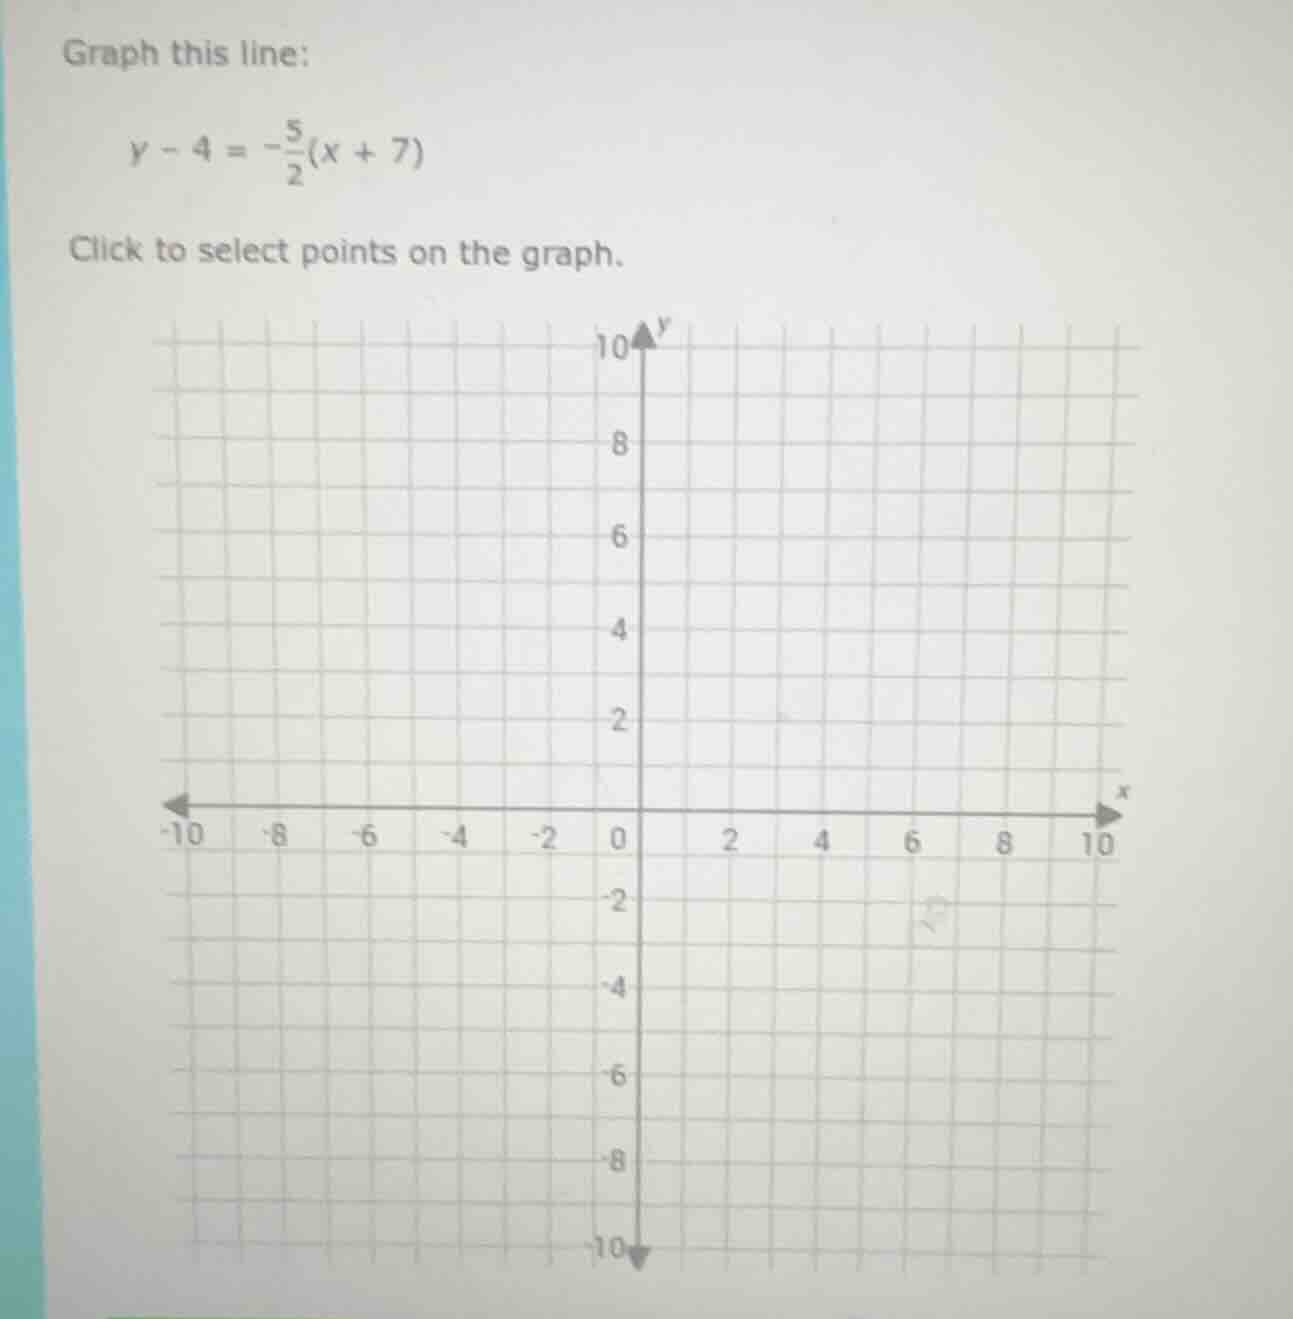
graph this line:
$y - 4 = -\frac{5}{2}(x + 7)$
click to select points on the graph.
graph with x-axis from -10 to 10 and y-axis from -10 to 10, grid lines
Step1: Identify the point - slope form
The equation \(y - 4=-\frac{5}{2}(x + 7)\) is in point - slope form \(y - y_1=m(x - x_1)\), where \((x_1,y_1)=(- 7,4)\) and the slope \(m =-\frac{5}{2}\). So we can start by plotting the point \((-7,4)\).
Step2: Use the slope to find another point
The slope \(m =-\frac{5}{2}=\frac{\text{rise}}{\text{run}}\). From the point \((-7,4)\), if we move the "run" (horizontal change) of \(2\) units to the right (since the denominator of the slope is \(2\) and we want to move in the positive \(x\) - direction for simplicity) and the "rise" (vertical change) of \(- 5\) units (downward, because the numerator is \(-5\)), we get a new \(x\) - coordinate: \(x=-7 + 2=-5\) and a new \(y\) - coordinate: \(y = 4-5=-1\). So the point \((-5,-1)\) is also on the line.
We can also find the \(y\) - intercept by converting the equation to slope - intercept form (\(y=mx + b\)).
Step3: Convert to slope - intercept form
Start with \(y - 4=-\frac{5}{2}(x + 7)\)
Expand the right - hand side: \(y-4=-\frac{5}{2}x-\frac{35}{2}\)
Add \(4\) to both sides: \(y=-\frac{5}{2}x-\frac{35}{2}+4\)
Since \(4=\frac{8}{2}\), then \(y=-\frac{5}{2}x-\frac{35 - 8}{2}=-\frac{5}{2}x-\frac{27}{2}=-2.5x - 13.5\)
To find the \(y\) - intercept, set \(x = 0\): \(y=-13.5\), so the \(y\) - intercept is \((0,-13.5)\)
To find the \(x\) - intercept, set \(y = 0\):
\(0=-\frac{5}{2}x-\frac{27}{2}\)
Add \(\frac{5}{2}x\) to both sides: \(\frac{5}{2}x=-\frac{27}{2}\)
Multiply both sides by \(\frac{2}{5}\): \(x=-\frac{27}{5}=-5.4\)
To graph the line, we can plot two points (e.g., \((-7,4)\) and \((-5,-1)\) or \((0,-13.5)\) and \((-5.4,0)\)) and then draw a straight line through them.
(Note: When graphing on the given grid, the points \((-7,4)\) and \((-5,-1)\) are easier to plot as they have integer or near - integer coordinates that fit within the visible grid range better than the intercepts in some cases. The \(y\) - intercept \((0,-13.5)\) is below the visible part of the grid shown, and the \(x\) - intercept \((-5.4,0)\) is also a bit tricky to plot precisely on the grid, but \((-7,4)\) and \((-5,-1)\) can be plotted by moving 7 units left of the origin on the \(x\) - axis and 4 units up on the \(y\) - axis for \((-7,4)\), and then from \((-7,4)\), moving 2 units right (to \(x=-5\)) and 5 units down (to \(y = - 1\)) for \((-5,-1)\))

Snap & solve any problem in the app
Get step-by-step solutions on Sovi AI
Photo-based solutions with guided steps
Explore more problems and detailed explanations
To graph the line \(y - 4=-\frac{5}{2}(x + 7)\), plot the points \((-7,4)\) and \((-5,-1)\) (or other points found from the equation) and draw a straight line through them. The line has a slope of \(-\frac{5}{2}\) and passes through the point \((-7,4)\).