QUESTION IMAGE
Question
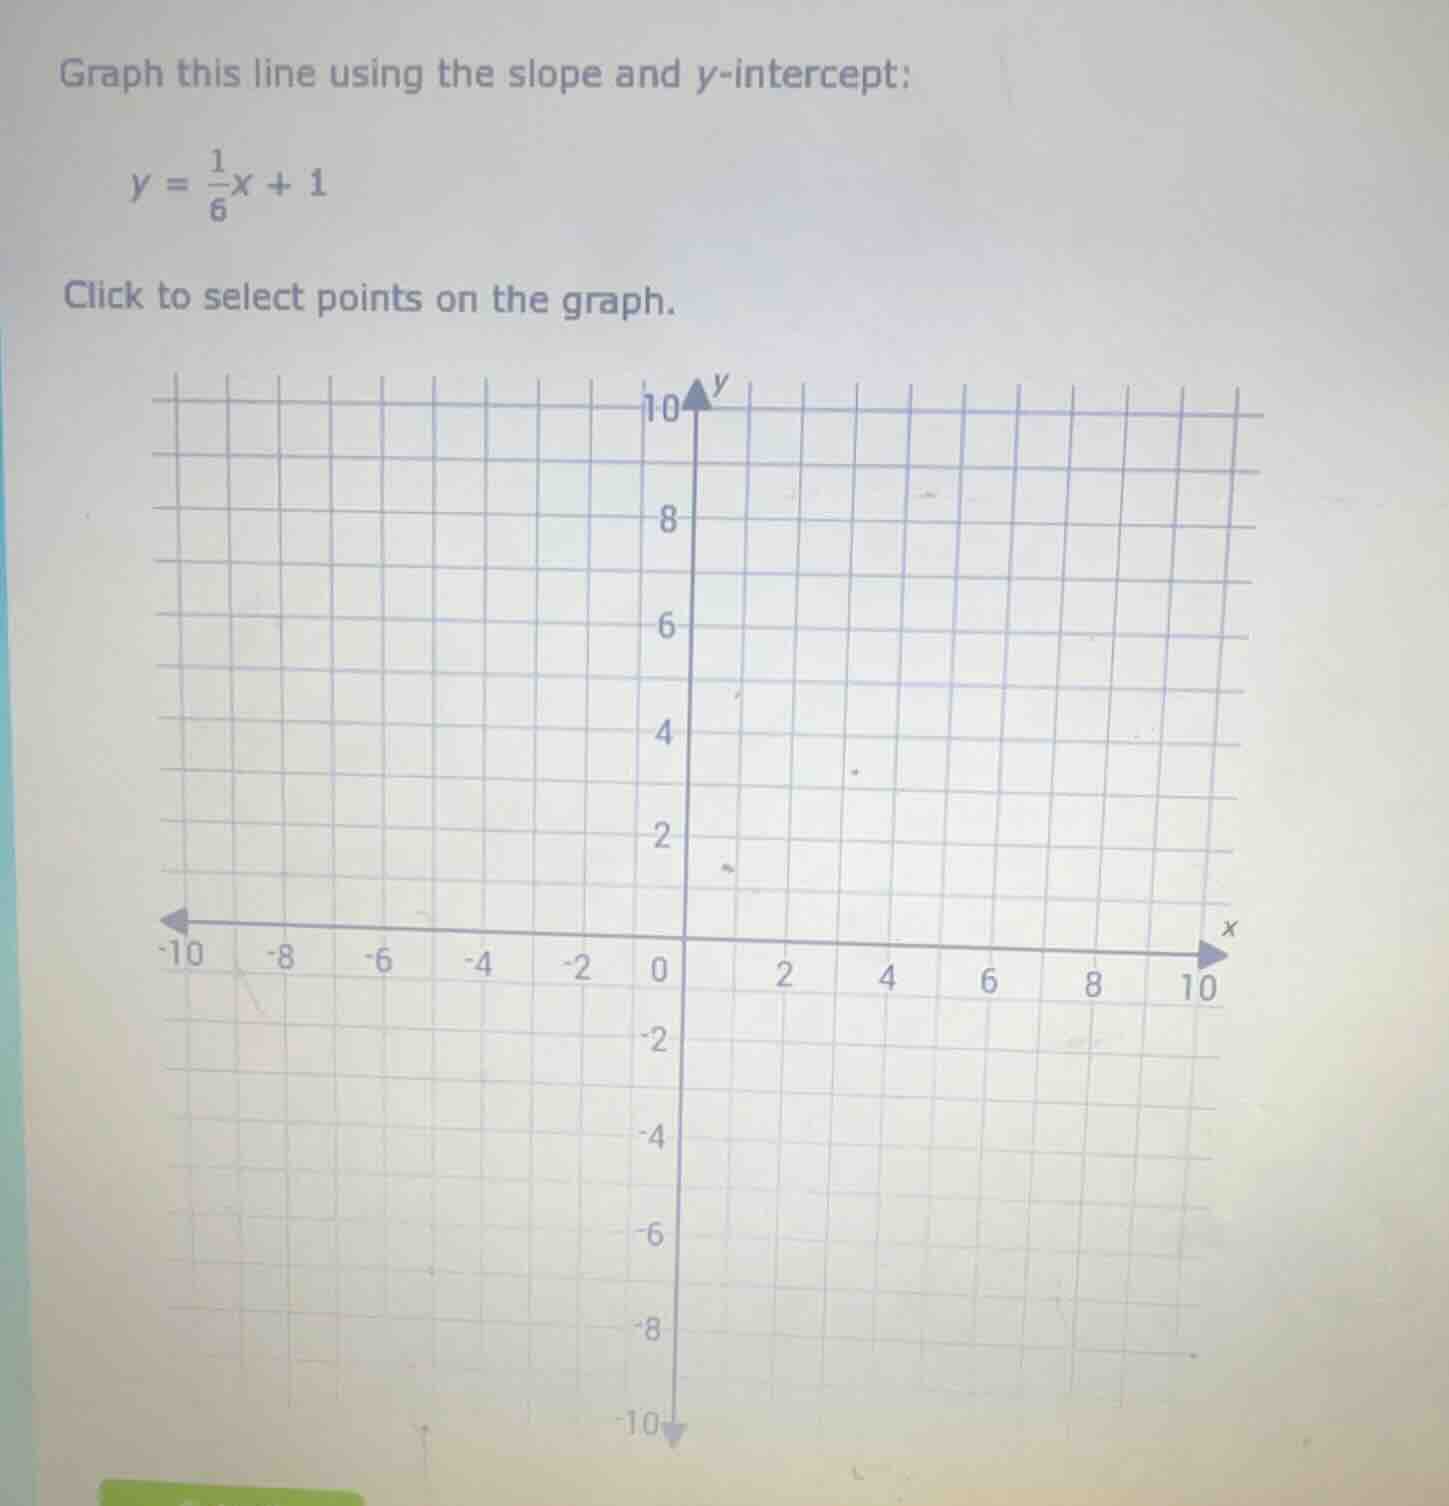
graph this line using the slope and y-intercept:
$y = \frac{1}{6}x + 1$
click to select points on the graph.
graph with x-axis from -10 to 10 and y-axis from -10 to 10, grid lines
Step1: Identify y-intercept
The equation is in slope - intercept form \(y = mx + b\), where \(b\) is the y - intercept. For \(y=\frac{1}{6}x + 1\), \(b = 1\). So the y - intercept is the point \((0,1)\). We plot this point on the graph (where \(x = 0\) and \(y=1\)).
Step2: Use slope to find next point
The slope \(m=\frac{1}{6}\), which means for a run of \(6\) (change in \(x\)), the rise is \(1\) (change in \(y\)). Starting from the y - intercept \((0,1)\), if we move \(6\) units to the right (increase \(x\) by \(6\), so \(x=0 + 6=6\)) and \(1\) unit up (increase \(y\) by \(1\), so \(y = 1+1 = 2\)), we get the point \((6,2)\). We can also move in the opposite direction: from \((0,1)\), move \(6\) units to the left (\(x = 0-6=- 6\)) and \(1\) unit down (\(y=1 - 1=0\)) to get the point \((-6,0)\).
Step3: Draw the line
After plotting at least two points (e.g., \((0,1)\) and \((6,2)\) or \((0,1)\) and \((-6,0)\)), we draw a straight line passing through these points.
(Note: Since the question is about graphing, the main steps are identifying the y - intercept, using the slope to find other points, and then drawing the line. If we were to just list the key points for graphing, the two main points are \((0,1)\) and \((6,2)\) (or \((-6,0)\)) and then the line is drawn through them.)

Snap & solve any problem in the app
Get step-by-step solutions on Sovi AI
Photo-based solutions with guided steps
Explore more problems and detailed explanations
To graph the line \(y=\frac{1}{6}x + 1\):
- Plot the y - intercept \((0,1)\) (since when \(x = 0\), \(y=1\)).
- Use the slope \(\frac{1}{6}\): from \((0,1)\), move 6 units right and 1 unit up to get \((6,2)\) (or 6 units left and 1 unit down to get \((-6,0)\)).
- Draw a straight line through the plotted points.