QUESTION IMAGE
Question
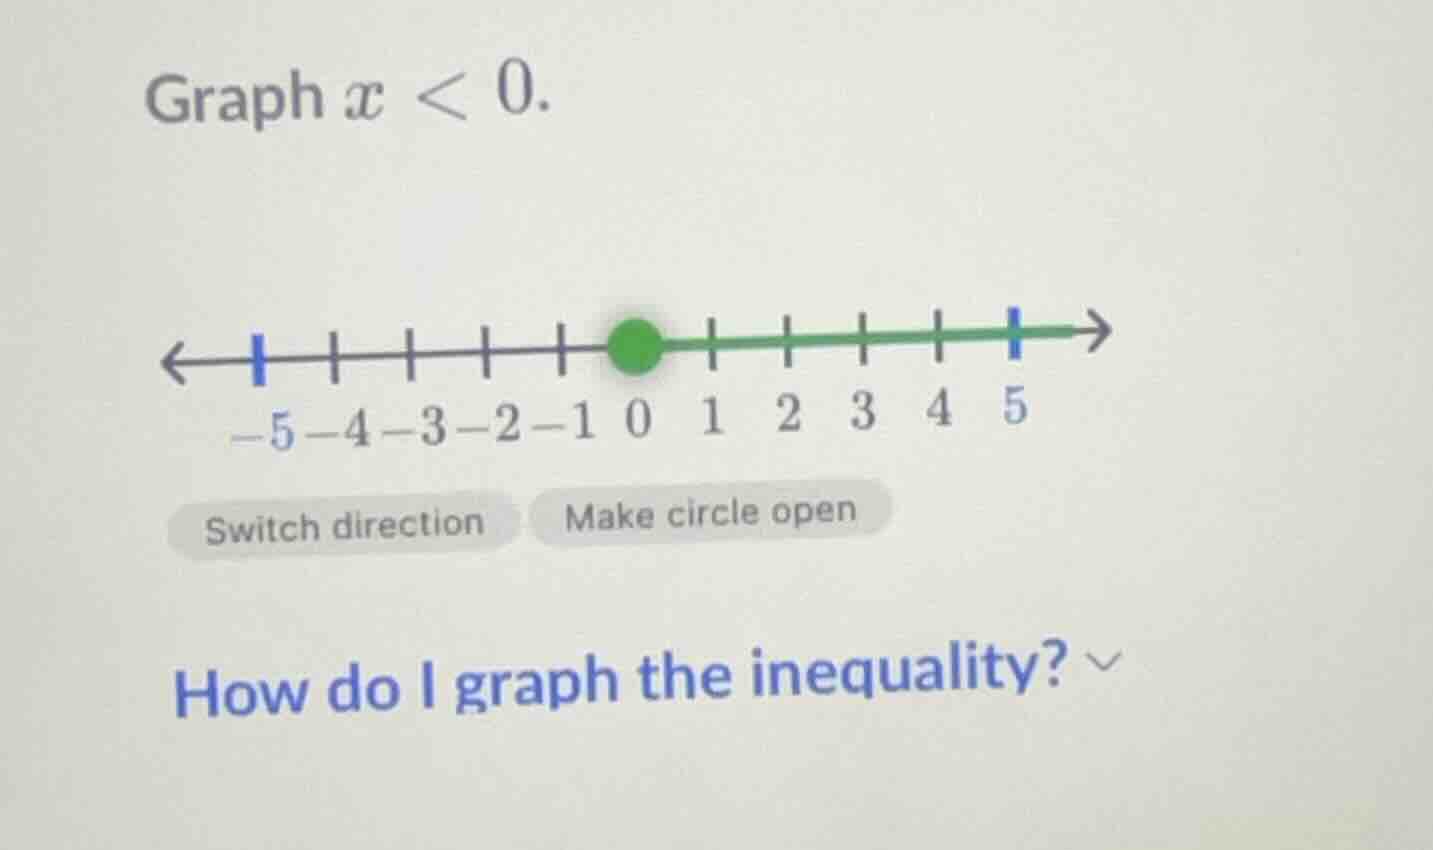
graph $x < 0$.
(number line with -5 to 5, green dot at 0, green line to the right; buttons: switch direction, make circle open)
how do i graph the inequality?
Step1: Analyze the inequality
The inequality is \( x < 0 \). This means we are looking for all real numbers less than 0.
Step2: Determine the circle type
Since the inequality is \( x < 0 \) (not \( x \leq 0 \)), the point at 0 is not included. So we need to make the circle open (to indicate that 0 is not part of the solution set).
Step3: Determine the direction of the line
We want all numbers less than 0, so the line should extend to the left of 0 (towards the negative numbers). So we also need to switch the direction from the current rightward to leftward.

Snap & solve any problem in the app
Get step-by-step solutions on Sovi AI
Photo-based solutions with guided steps
Explore more problems and detailed explanations
To graph \( x < 0 \):
- Make the circle open: Because \( x = 0 \) is not a solution (the inequality is strict, \( < \), not \( \leq \)).
- Switch direction: The solution includes all numbers less than 0, so the line should extend to the left of 0 (toward negative numbers), not right.
The correct graph will have an open circle at 0 and a line extending to the left.