QUESTION IMAGE
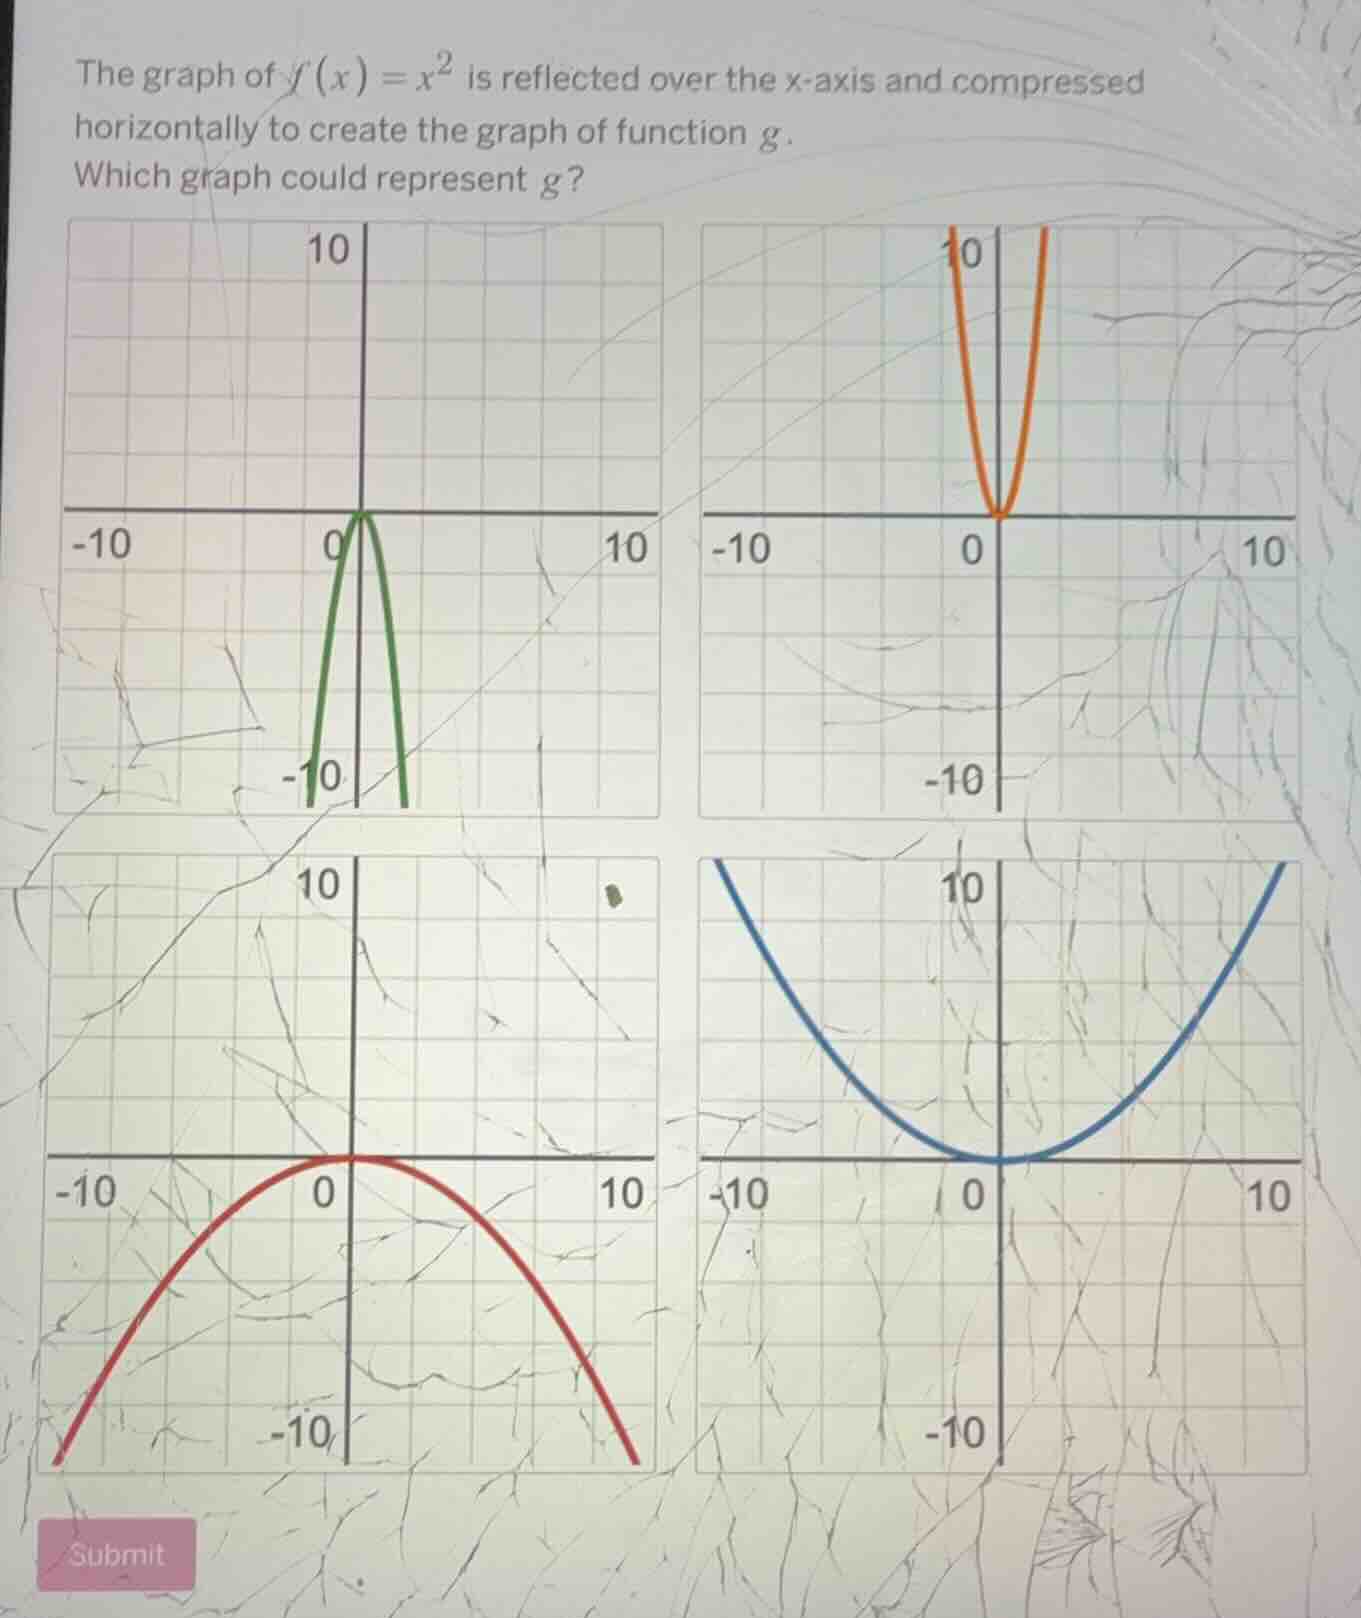
Question
the graph of $f(x) = x^2$ is reflected over the x-axis and compressed horizontally to create the graph of function $g$. which graph could represent $g$?
Step1: Reflect over x-axis
A reflection of $f(x)=x^2$ over the x-axis gives $g_1(x) = -x^2$. This flips the parabola downward, opening towards negative y-values.
Step2: Horizontal compression
A horizontal compression of $g_1(x)$ by a factor $k>1$ gives $g(x) = -(kx)^2 = -k^2x^2$. This makes the parabola narrower (steeper sides) than the original reflected parabola $-x^2$.
Step3: Match to graphs
The green graph is a downward-opening, narrow parabola, matching the transformations. The red graph is downward-opening but wide (horizontal stretch), the orange/blue graphs open upward (no x-axis reflection).

Snap & solve any problem in the app
Get step-by-step solutions on Sovi AI
Photo-based solutions with guided steps
Explore more problems and detailed explanations
The top-left (green) graph