QUESTION IMAGE
Question
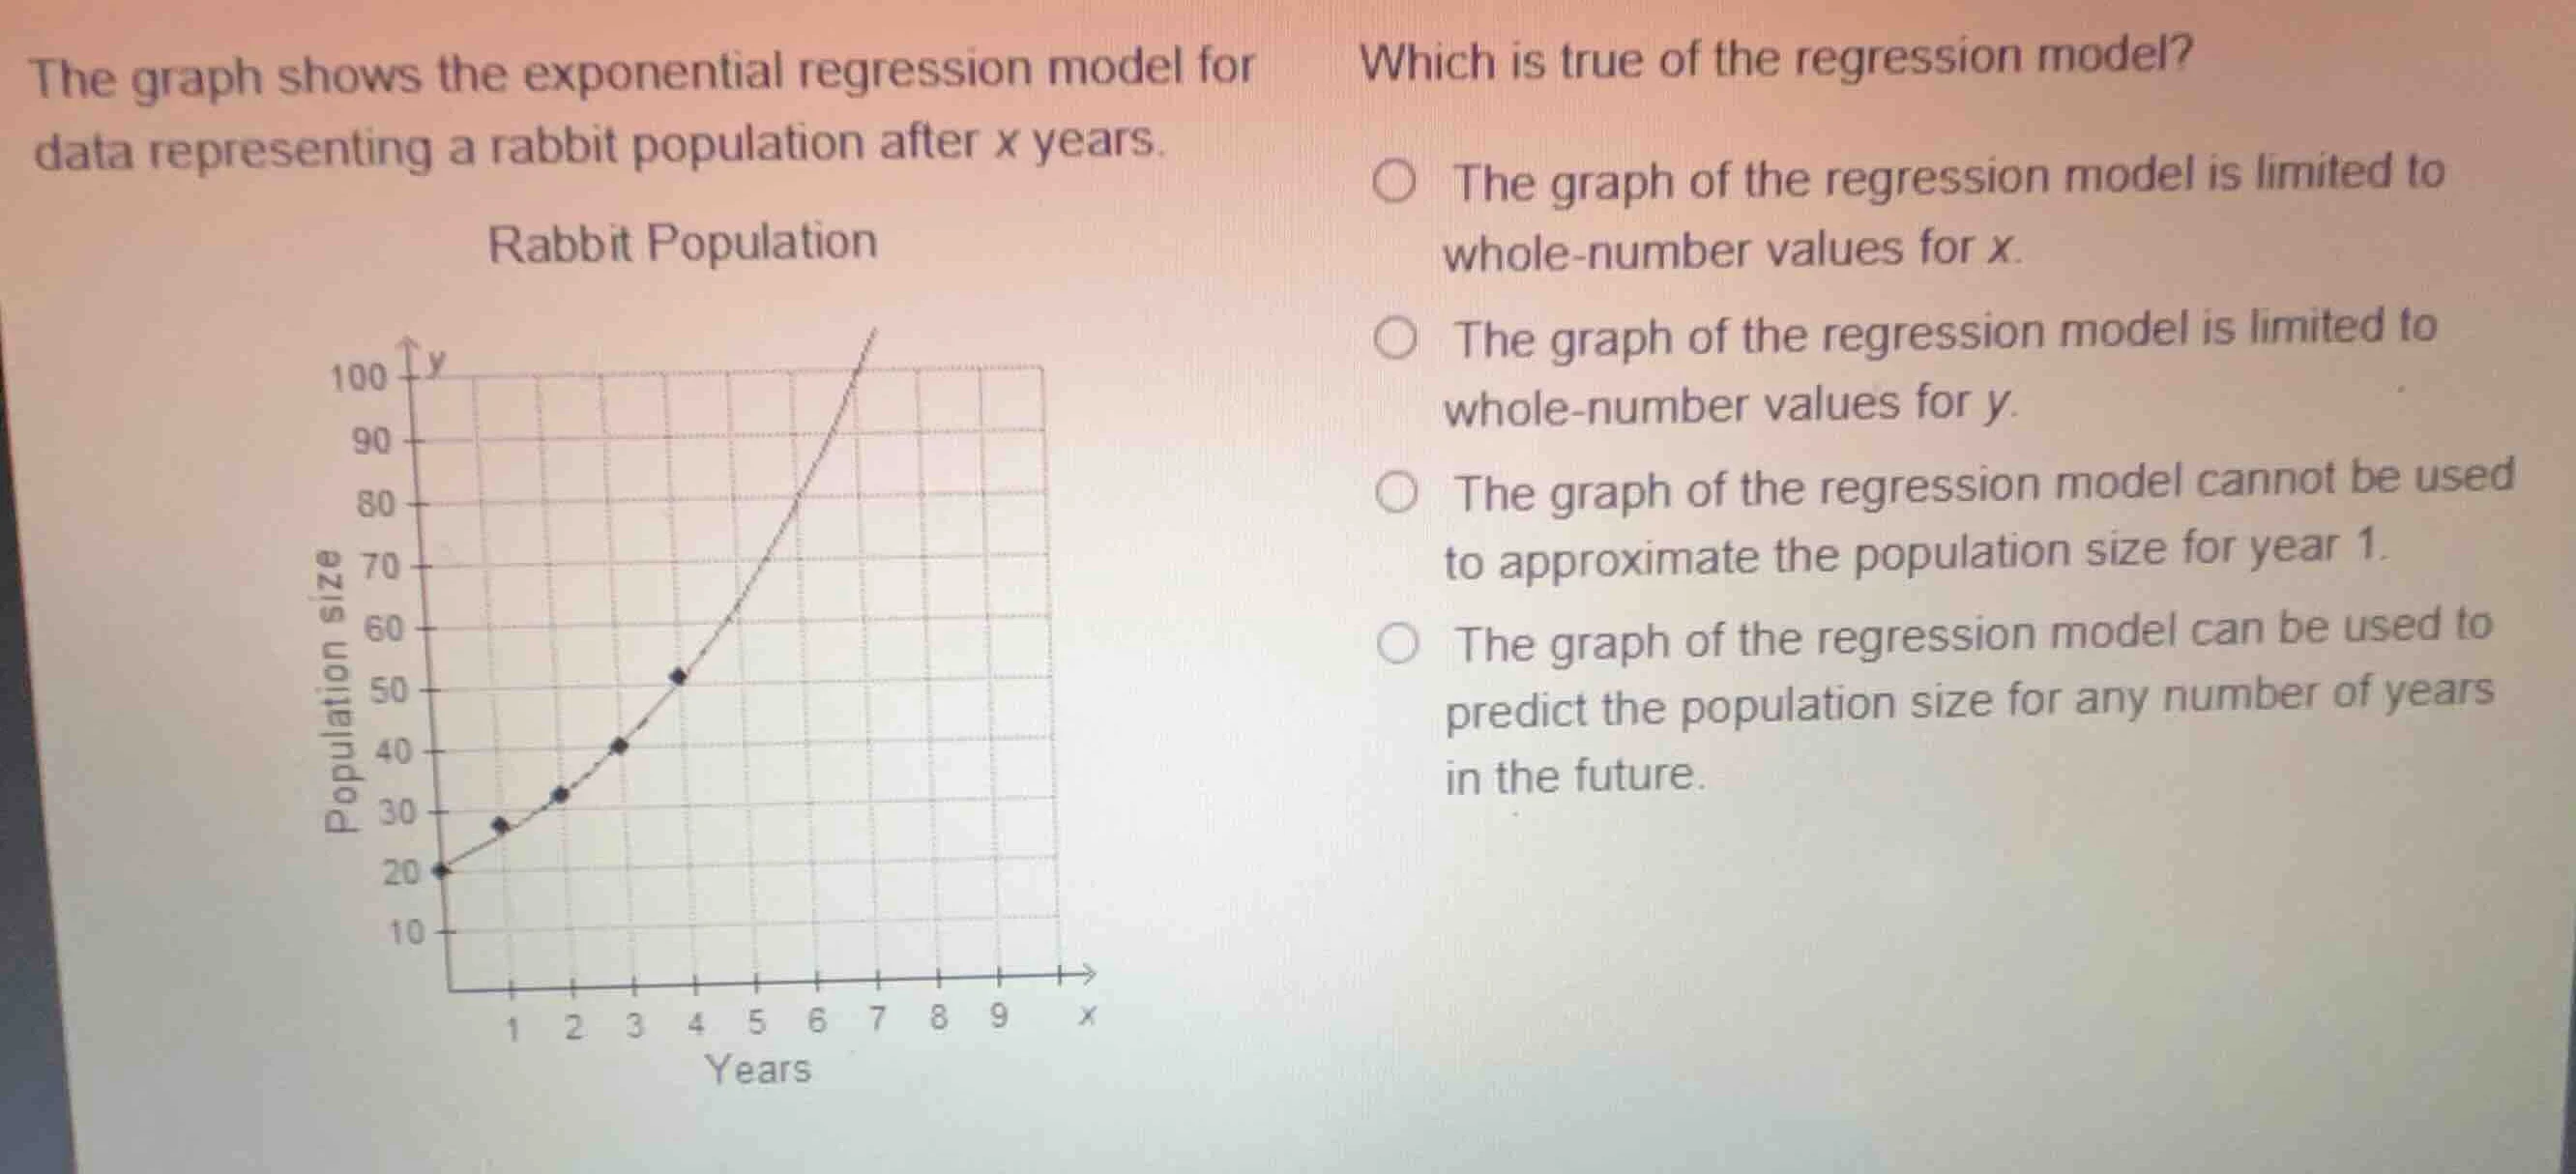
the graph shows the exponential regression model for data representing a rabbit population after \\(x\\) years.
which is true of the regression model?
- the graph of the regression model is limited to whole-number values for \\(x\\).
- the graph of the regression model is limited to whole-number values for \\(y\\).
- the graph of the regression model cannot be used to approximate the population size for year 1.
- the graph of the regression model can be used to predict the population size for any number of years in the future.
<pre_analysis>
{
"quality": "clear",
"question_count": 1,
"skills_matched": [
"direct_cot",
"multiple_choice_formatter",
"explain_then_answer",
"quick"
],
"needs_drawing": false,
"concepts_used": [
"Exponential Regression",
"Graph Interpretation",
"Extrapolation"
],
"new_concepts": [],
"current_concepts": [
"Exponential Regression",
"Graph Interpretation",
"Extrapolation"
]
}
</pre_analysis>
<reasoning>
Analyze the nature of regression models
A regression model is a continuous mathematical function (in this case, an exponential curve) fitted to a set of discrete data points. Because the model is a continuous function, its domain and range are not restricted to whole numbers, meaning both \(x\) (time in years) and \(y\) (population size) can take on any real value along the curve.
Evaluate the statements regarding domain and range limits
- "The graph of the regression model is limited to whole-number values for \(x\)": Incorrect, because time \(x\) is continuous.
- "The graph of the regression model is limited to whole-number values for \(y\)": Incorrect, because the function yields continuous real values for \(y\), even though actual rabbits are discrete.
- "The graph of the regression model cannot be used to approximate the population size for year 1": Incorrect, because \(x = 1\) is within the domain of the data and can be easily approximated using the curve (interpolation).
Evaluate prediction capabilities
- "The graph of the regression model can be used to predict the population size for any number of years in the future": Correct, because a regression model defines a function over an infinite domain \(x \ge 0\), allowing for extrapolation to predict future values.
</reasoning>
<answer>
<mcq-option>The graph of the regression model is limited to whole-number values for x.</mcq-option>
<mcq-option>The graph of the regression model is limited to whole-number values for y.</mcq-option>
<mcq-option>The graph of the regression model cannot be used to approximate the population size for year 1.</mcq-option>
<mcq-correct>The graph of the regression model can be used to predict the population size for any number of years in the future.</mcq-correct>
</answer>
<post_analysis>
{
"subject": "Mathematics",
"question_type": "Multiple Choice",
"knowledge_point": [
"Mathematics",
"Statistics",
"Exponential Regression"
]
}
</post_analysis>

Snap & solve any problem in the app
Get step-by-step solutions on Sovi AI
Photo-based solutions with guided steps
Explore more problems and detailed explanations
<pre_analysis>
{
"quality": "clear",
"question_count": 1,
"skills_matched": [
"direct_cot",
"multiple_choice_formatter",
"explain_then_answer",
"quick"
],
"needs_drawing": false,
"concepts_used": [
"Exponential Regression",
"Graph Interpretation",
"Extrapolation"
],
"new_concepts": [],
"current_concepts": [
"Exponential Regression",
"Graph Interpretation",
"Extrapolation"
]
}
</pre_analysis>
<reasoning>
Analyze the nature of regression models
A regression model is a continuous mathematical function (in this case, an exponential curve) fitted to a set of discrete data points. Because the model is a continuous function, its domain and range are not restricted to whole numbers, meaning both \(x\) (time in years) and \(y\) (population size) can take on any real value along the curve.
Evaluate the statements regarding domain and range limits
- "The graph of the regression model is limited to whole-number values for \(x\)": Incorrect, because time \(x\) is continuous.
- "The graph of the regression model is limited to whole-number values for \(y\)": Incorrect, because the function yields continuous real values for \(y\), even though actual rabbits are discrete.
- "The graph of the regression model cannot be used to approximate the population size for year 1": Incorrect, because \(x = 1\) is within the domain of the data and can be easily approximated using the curve (interpolation).
Evaluate prediction capabilities
- "The graph of the regression model can be used to predict the population size for any number of years in the future": Correct, because a regression model defines a function over an infinite domain \(x \ge 0\), allowing for extrapolation to predict future values.
</reasoning>
<answer>
<mcq-option>The graph of the regression model is limited to whole-number values for x.</mcq-option>
<mcq-option>The graph of the regression model is limited to whole-number values for y.</mcq-option>
<mcq-option>The graph of the regression model cannot be used to approximate the population size for year 1.</mcq-option>
<mcq-correct>The graph of the regression model can be used to predict the population size for any number of years in the future.</mcq-correct>
</answer>
<post_analysis>
{
"subject": "Mathematics",
"question_type": "Multiple Choice",
"knowledge_point": [
"Mathematics",
"Statistics",
"Exponential Regression"
]
}
</post_analysis>