QUESTION IMAGE
Question
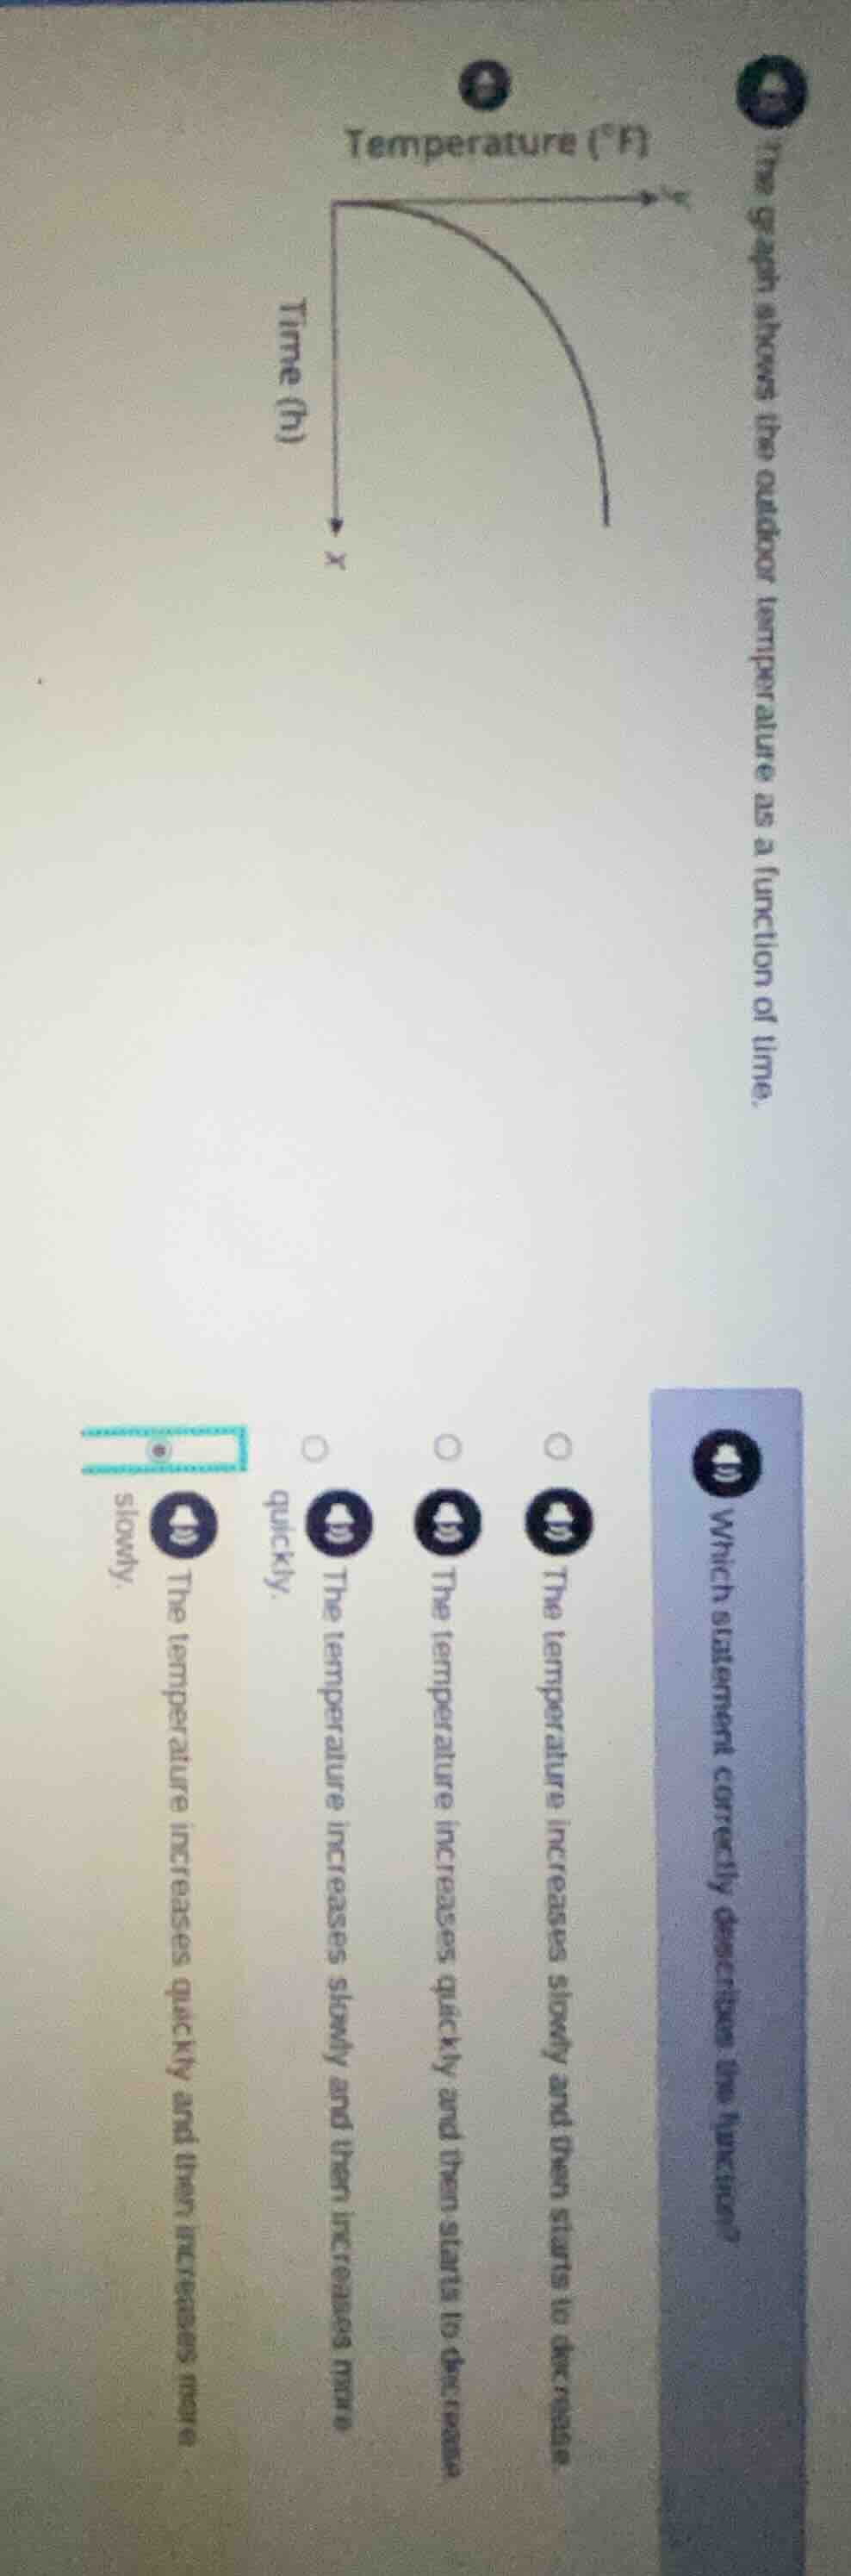
the graph shows the outdoor temperature as a function of time. which statement correctly describes the function? the temperature increases slowly and then starts to decrease. the temperature increases quickly and then starts to decrease. the temperature increases slowly and then increases more quickly. the temperature increases quickly and then increases more slowly.
The graph has time (x-axis) increasing from left to right, and temperature (y-axis) first rises gradually (slow increase) then falls with a steeper downward slope (starts decreasing). This matches the first option's description.

Snap & solve any problem in the app
Get step-by-step solutions on Sovi AI
Photo-based solutions with guided steps
Explore more problems and detailed explanations
The temperature increases slowly and then starts to decrease.