QUESTION IMAGE
Question
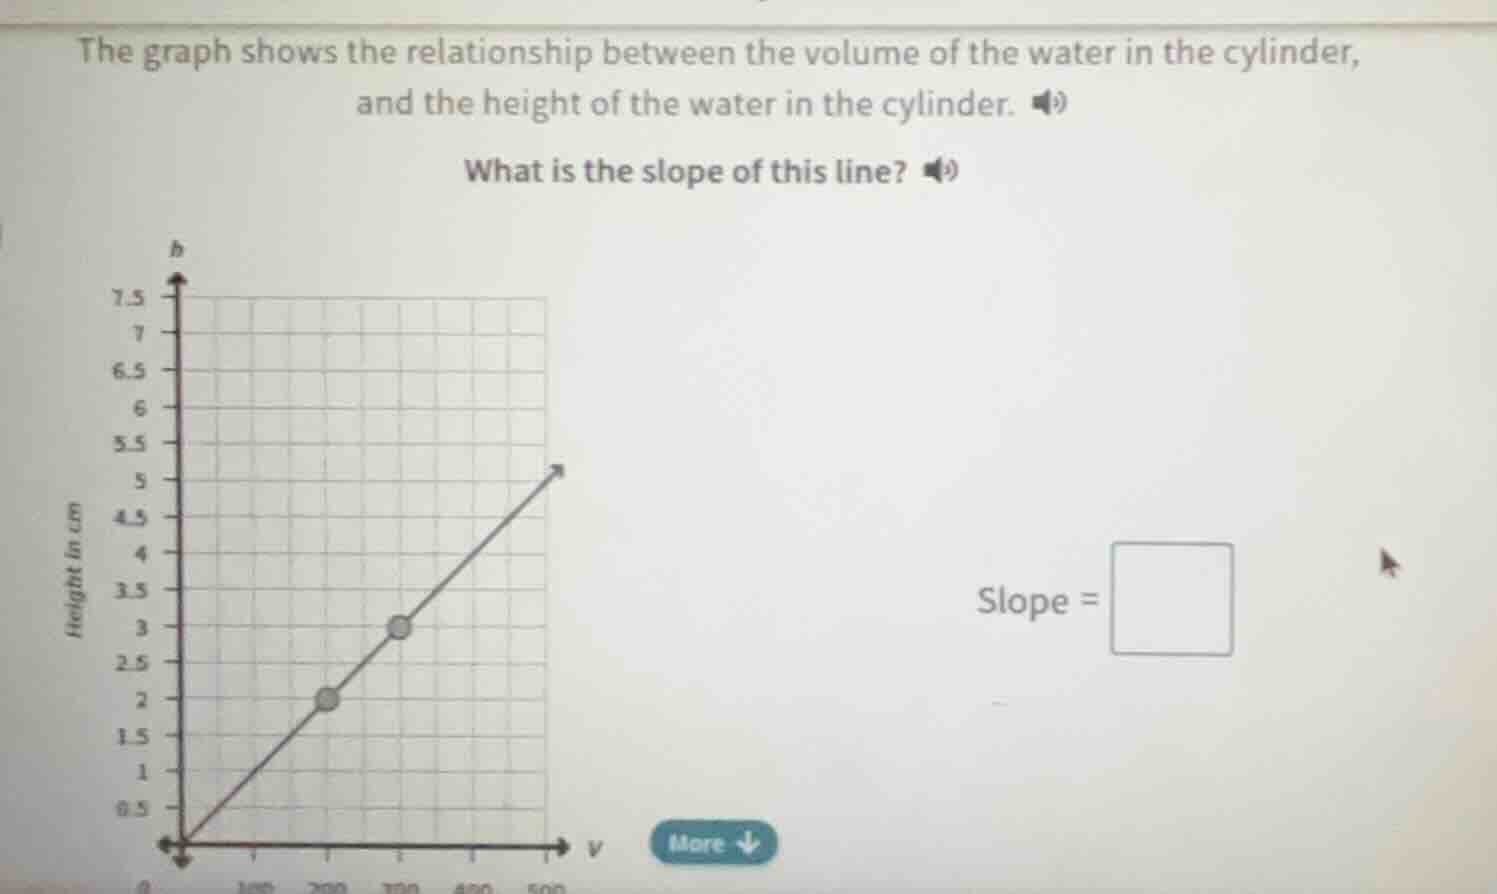
the graph shows the relationship between the volume of the water in the cylinder, and the height of the water in the cylinder. what is the slope of this line? slope =
Step1: Identify two points on the line
From the graph, we can see two clear points: when \( V = 200 \) (volume), \( h = 2 \) (height), and when \( V = 300 \), \( h = 3 \). So the two points are \((200, 2)\) and \((300, 3)\).
Step2: Use the slope formula
The slope formula is \( m=\frac{y_2 - y_1}{x_2 - x_1} \). Here, \( x \) represents volume (\( V \)) and \( y \) represents height (\( h \)). Let \((x_1,y_1)=(200, 2)\) and \((x_2,y_2)=(300, 3)\). Then:
\( m=\frac{3 - 2}{300 - 200}=\frac{1}{100} = 0.01 \)

Snap & solve any problem in the app
Get step-by-step solutions on Sovi AI
Photo-based solutions with guided steps
Explore more problems and detailed explanations
\( 0.01 \) (or \(\frac{1}{100}\))