QUESTION IMAGE
Question
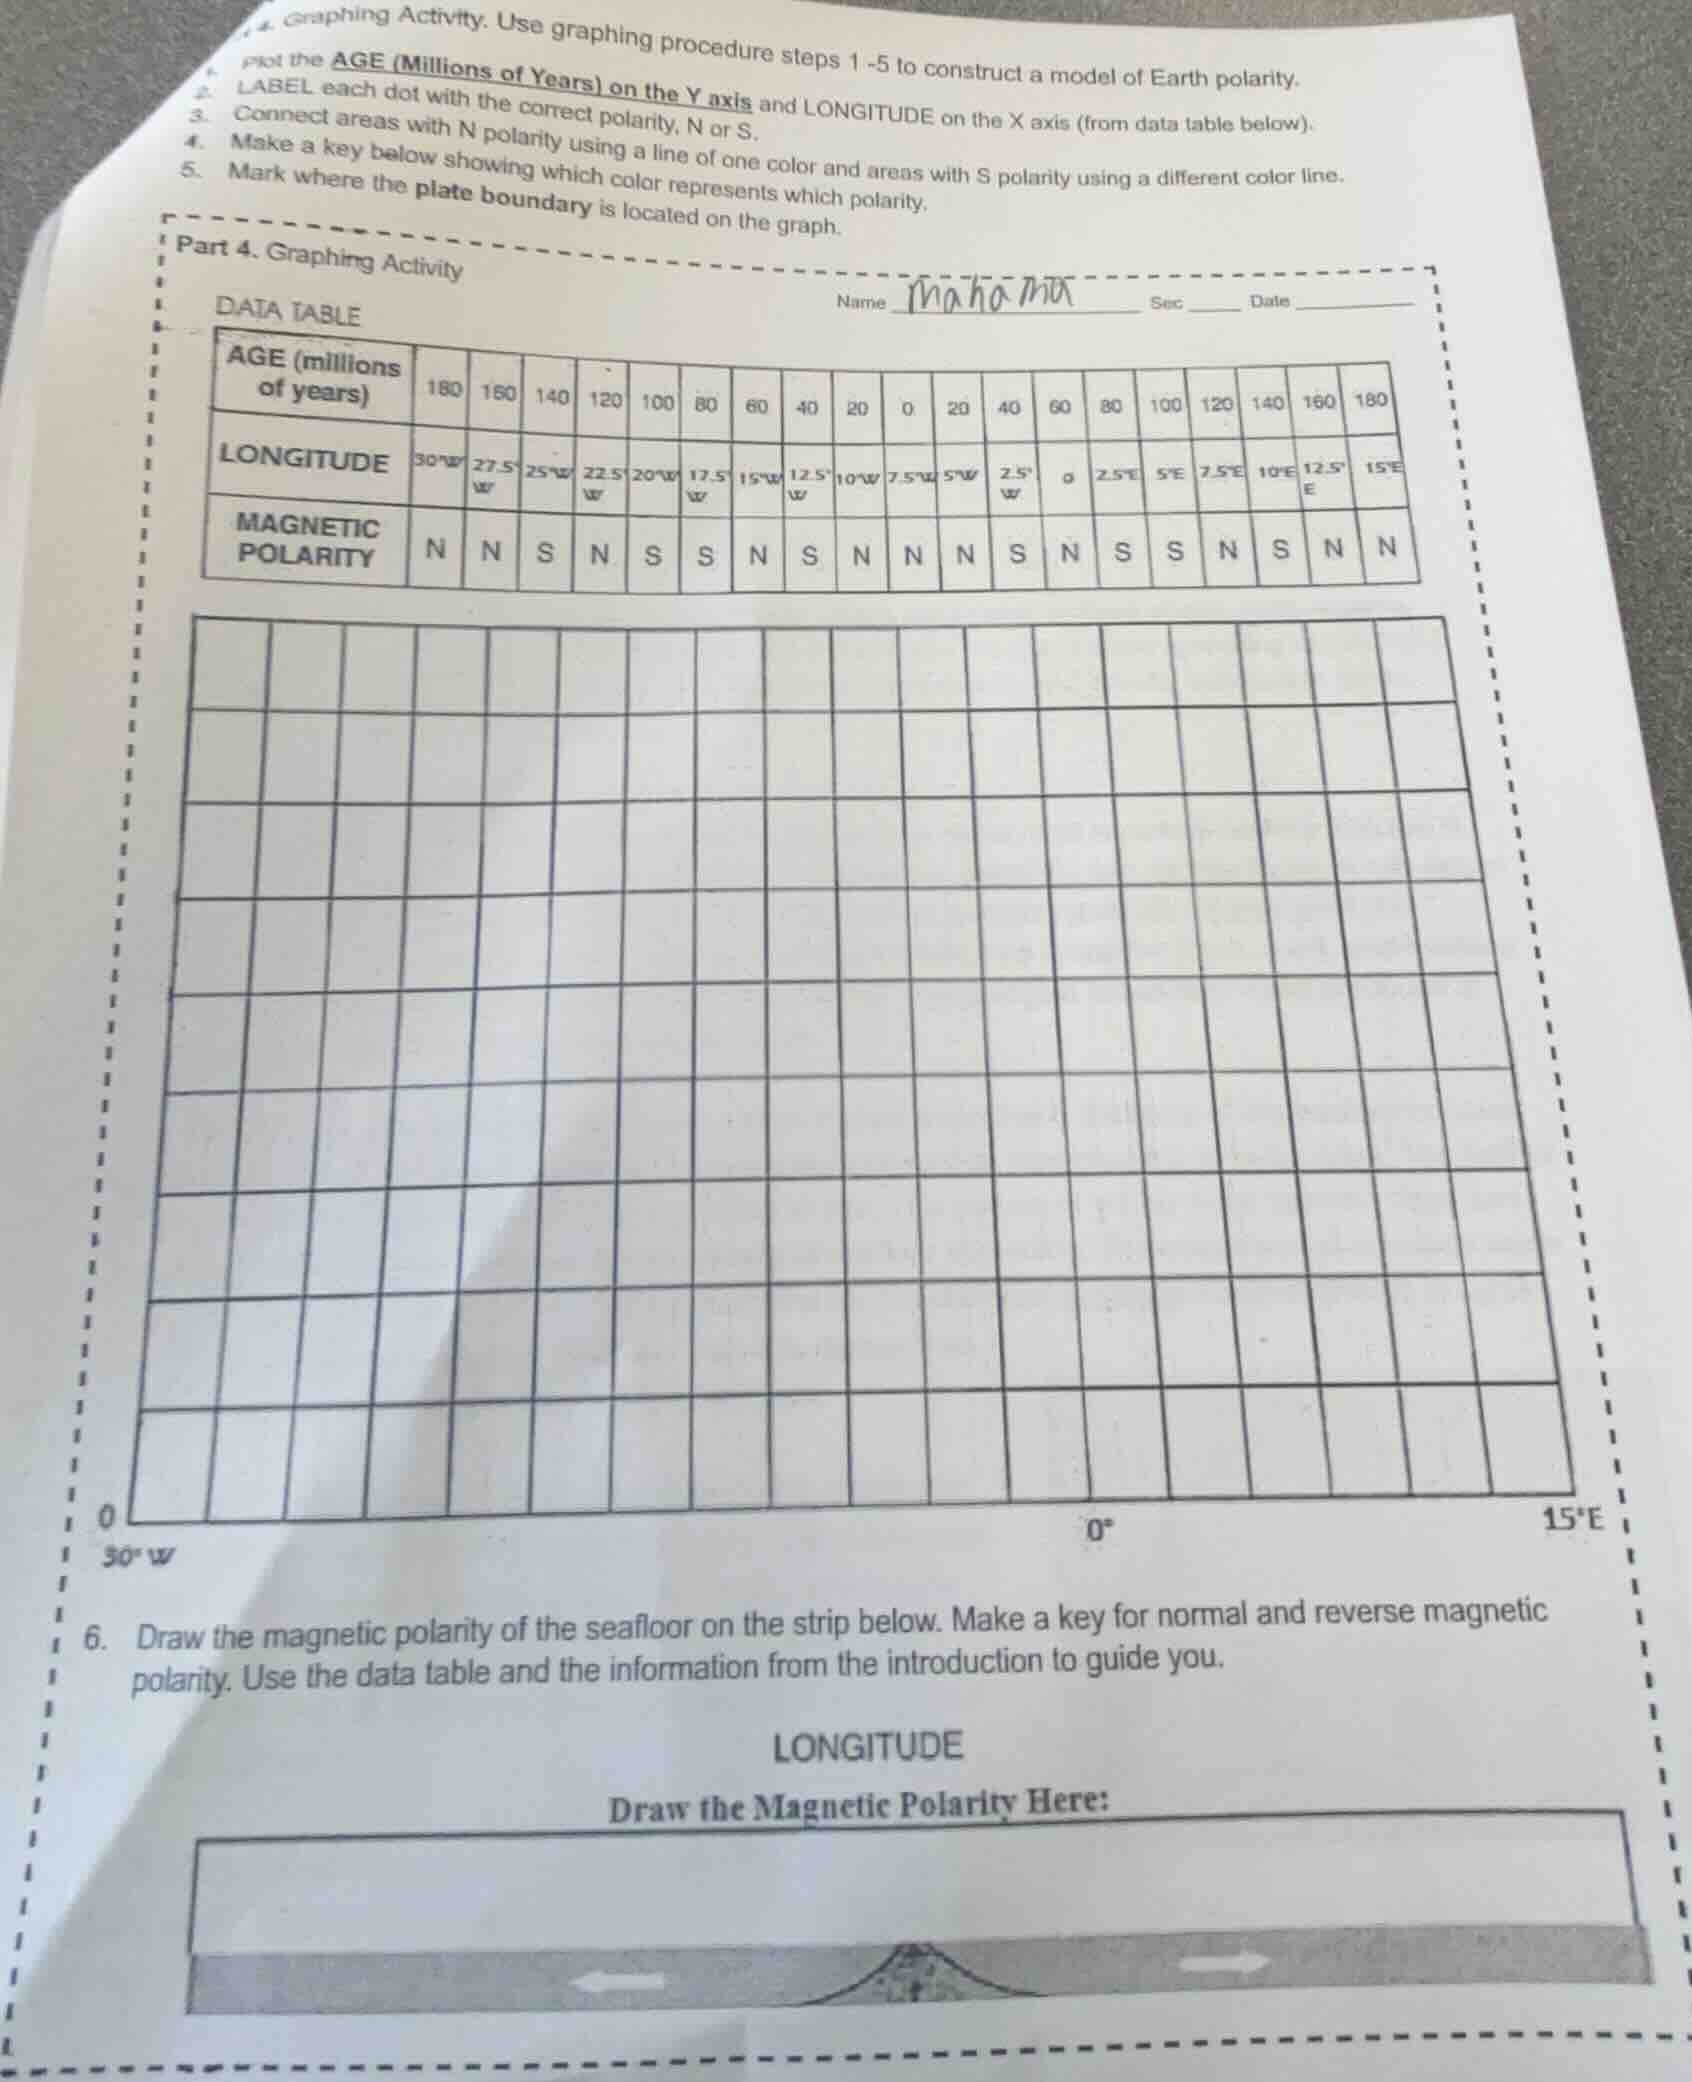
- graphing activity. use graphing procedure steps 1 - 5 to construct a model of earth polarity.
- plot the age (millions of years) on the y axis and longitude on the x axis (from data table below).
- label each dot with the correct polarity, n or s.
- connect areas with n polarity using a line of one color and areas with s polarity using a different color line.
- make a key below showing which color represents which polarity.
- mark where the plate boundary is located on the graph.
part 4. graphing activity
name
sec
date
data table
age (millions of years) | 180 | 160 | 140 | 120 | 100 | 80 | 60 | 40 | 20 | 0 | 20 | 40 | 60 | 80 | 100 | 120 | 140 | 160 | 180
longitude | 30°w | 27.5°w | 25°w | 22.5°w | 20°w | 17.5°w | 15°w | 12.5°w | 10°w | 7.5°w | 5°w | 2.5°w | 0 | 2.5°e | 5°e | 7.5°e | 10°e | 12.5°e | 15°e
magnetic polarity | n | n | s | n | s | s | n | s | n | n | n | s | n | s | s | n | s | n | n
- draw the magnetic polarity of the seafloor on the strip below. make a key for normal and reverse magnetic polarity. use the data table and the information from the introduction to guide you.
longitude
draw the magnetic polarity here:
Step1: Label graph axes
X-axis: Longitude (30°W to 15°E), Y-axis: Age (0 to 180 million years)
Step2: Plot data points
For each pair:
$(30^\circ W, 180, N), (27.5^\circ W, 160, N), (25^\circ W, 140, S), (22.5^\circ W, 120, N), (20^\circ W, 100, S), (17.5^\circ W, 80, S), (15^\circ W, 60, S), (12.5^\circ W, 40, N), (10^\circ W, 20, S), (7.5^\circ W, 0, N), (5^\circ W, 20, N), (2.5^\circ W, 40, N), (0^\circ, 60, S), (2.5^\circ E, 80, N), (5^\circ E, 100, S), (7.5^\circ E, 120, S), (10^\circ E, 140, S), (12.5^\circ E, 160, N), (15^\circ E, 180, N)$
Step3: Connect same polarity points
Use one color for all N polarity points, another for S polarity points.
Step4: Add key and plate boundary
Create a key for N/S colors; mark plate boundary at $0^\circ$ longitude (midpoint of the graph).
Step5: Draw polarity strip
On the lower strip, shade segments matching the table's polarity: start with N (30°W to 25°W), S (25°W to 20°W), N (22.5°W to 20°W), S (20°W to 15°W), N (12.5°W to 12.5°W), S (10°W to 10°W), N (7.5°W to 2.5°W), S (0° to 0°), N (2.5°E to 2.5°E), S (5°E to 10°E), N (12.5°E to 15°E), with the plate boundary at the central peak.

Snap & solve any problem in the app
Get step-by-step solutions on Sovi AI
Photo-based solutions with guided steps
Explore more problems and detailed explanations
- A completed graph with labeled axes, plotted points connected by color-coded lines (for N/S polarity), a polarity key, and the plate boundary marked at $0^\circ$ longitude.
- A completed lower strip with shaded segments corresponding to the magnetic polarity data, a key for normal (N) and reverse (S) polarity, and the plate boundary at the central mid-ocean ridge feature.