QUESTION IMAGE
Question
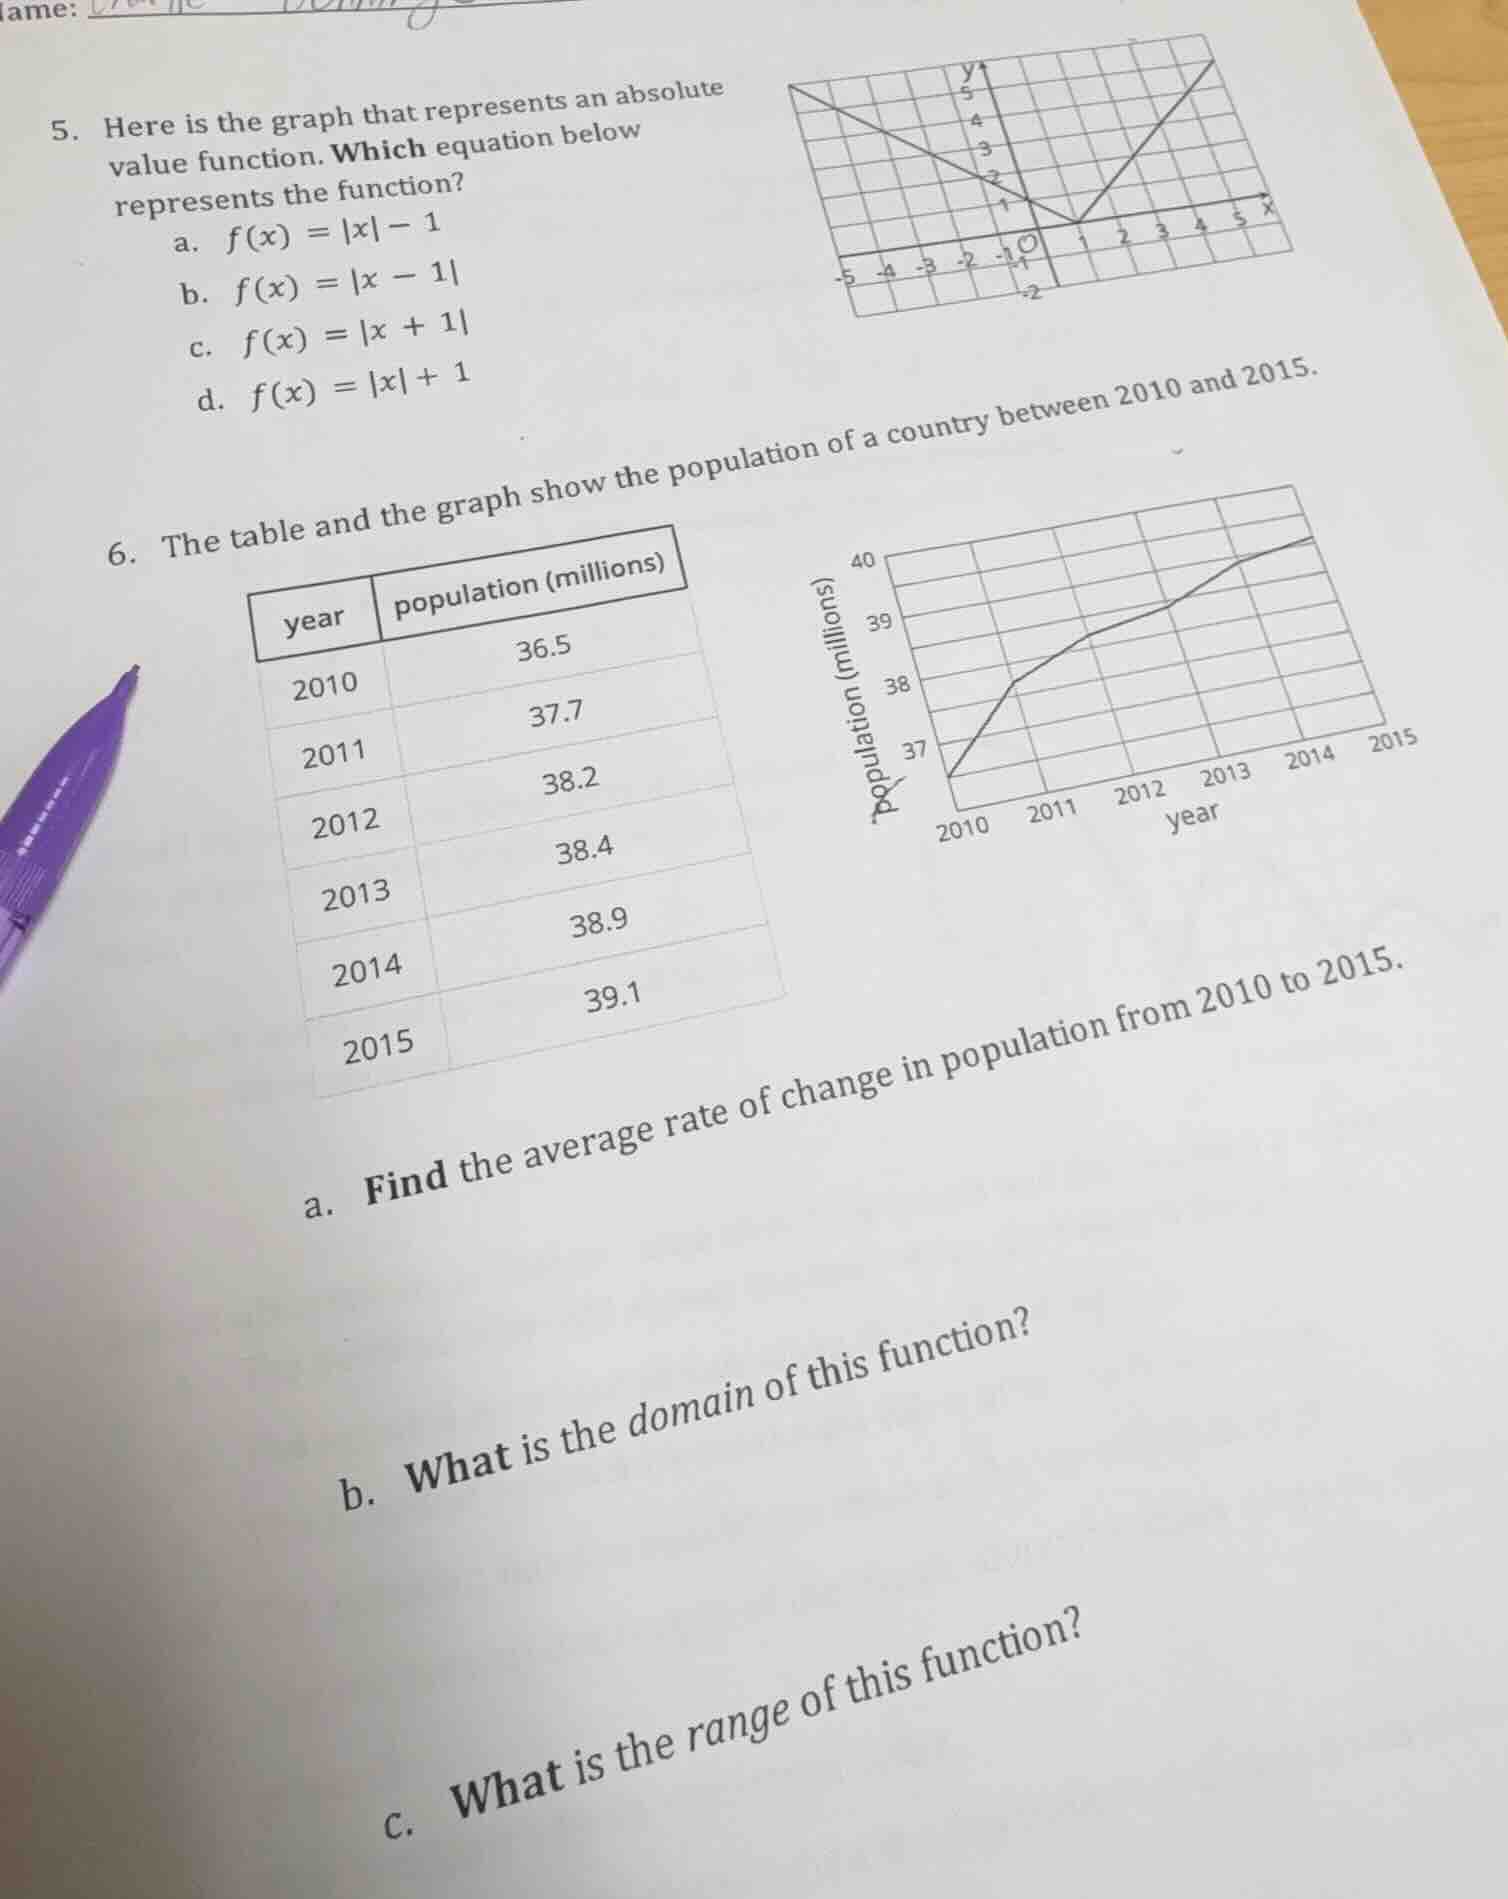
- here is the graph that represents an absolute value function. which equation below represents the function?
a. $f(x) = |x| - 1$
b. $f(x) = |x - 1|$
c. $f(x) = |x + 1|$
d. $f(x) = |x| + 1$
- the table and the graph show the population of a country between 2010 and 2015.
| year | population (millions) |
|---|---|
| 2011 | 37.7 |
| 2012 | 38.2 |
| 2013 | 38.4 |
| 2014 | 38.9 |
| 2015 | 39.1 |
a. find the average rate of change in population from 2010 to 2015.
b. what is the domain of this function?
c. what is the range of this function?
Question 5
Step1: Recall absolute value function vertex
The vertex of \( f(x) = |x - h| + k \) is \((h, k)\). The graph's vertex is at \((1, 0)\).
Step2: Analyze each option
- Option a: \( f(x) = |x| - 1 \) has vertex \((0, -1)\) – incorrect.
- Option b: \( f(x) = |x - 1| \) has vertex \((1, 0)\) – matches the graph.
- Option c: \( f(x) = |x + 1| = |x - (-1)| \) has vertex \((-1, 0)\) – incorrect.
- Option d: \( f(x) = |x| + 1 \) has vertex \((0, 1)\) – incorrect.
Step1: Identify formula for average rate of change
The formula for average rate of change is \( \frac{\Delta y}{\Delta x} = \frac{f(x_2) - f(x_1)}{x_2 - x_1} \). Here, \( x_1 = 2010 \), \( f(x_1) = 36.5 \); \( x_2 = 2015 \), \( f(x_2) = 39.1 \).
Step2: Calculate the change
\( \Delta y = 39.1 - 36.5 = 2.6 \), \( \Delta x = 2015 - 2010 = 5 \). Then, average rate of change \( = \frac{2.6}{5} = 0.52 \) (in millions per year).
The domain of a function representing population over time (years 2010–2015) includes all input values (years). So the domain is the set of years from 2010 to 2015, or in interval notation, \( [2010, 2015] \).

Snap & solve any problem in the app
Get step-by-step solutions on Sovi AI
Photo-based solutions with guided steps
Explore more problems and detailed explanations
b. \( f(x) = |x - 1| \)