QUESTION IMAGE
Question
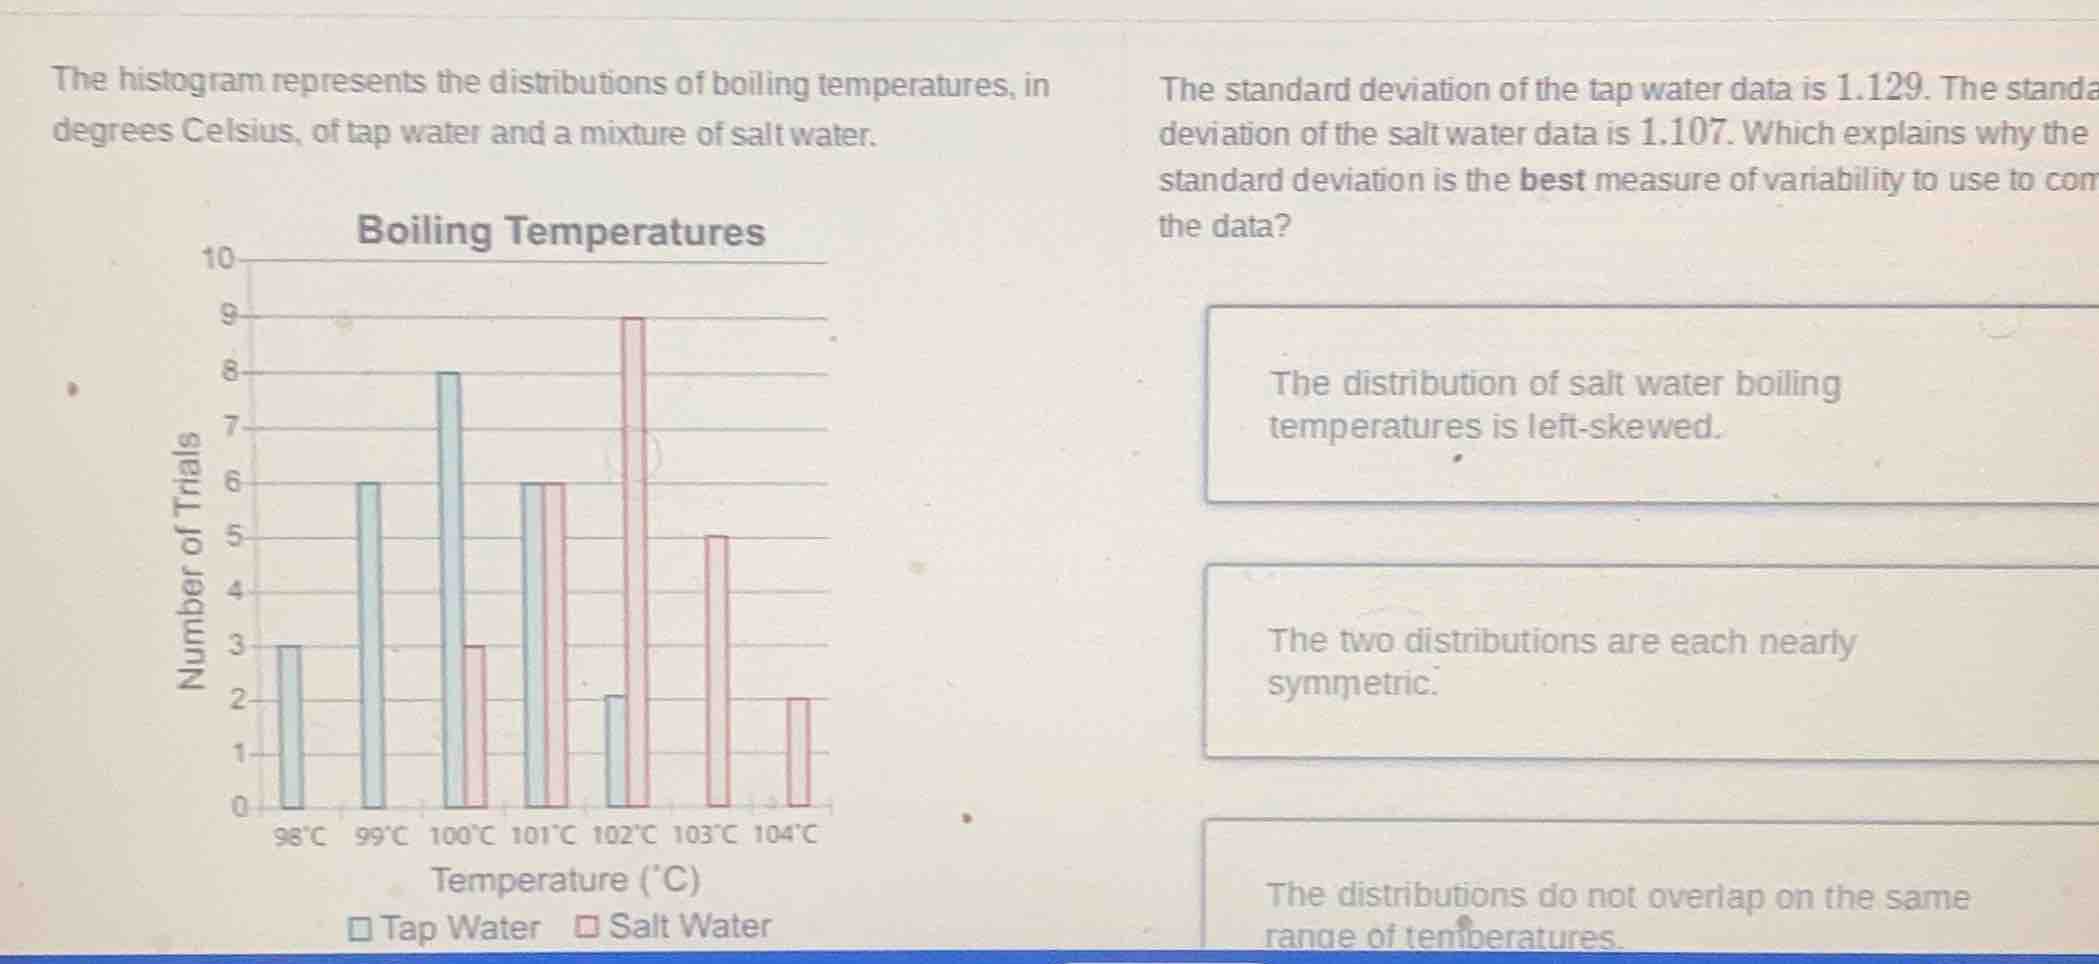
the histogram represents the distributions of boiling temperatures, in degrees celsius, of tap water and a mixture of salt water. the standard deviation of the tap water data is 1.129. the standard deviation of the salt water data is 1.107. which explains why the standard deviation is the best measure of variability to use to compare the data? options: the distribution of salt water boiling temperatures is left - skewed. the two distributions are each nearly symmetric. the distributions do not overlap on the same range of temperatures.
To determine why standard deviation is the best measure of variability, we analyze the distribution shapes. Standard deviation is suitable for symmetric distributions (not skewed) as it uses all data points. The first option (left - skewed salt water) would favor interquartile range (IQR) over standard deviation. The third option (no overlap) doesn't relate to standard deviation's suitability. The second option states both distributions are nearly symmetric, which means standard deviation (using all data) is appropriate as it's a good measure for symmetric data.

Snap & solve any problem in the app
Get step-by-step solutions on Sovi AI
Photo-based solutions with guided steps
Explore more problems and detailed explanations
The two distributions are each nearly symmetric.