QUESTION IMAGE
Question
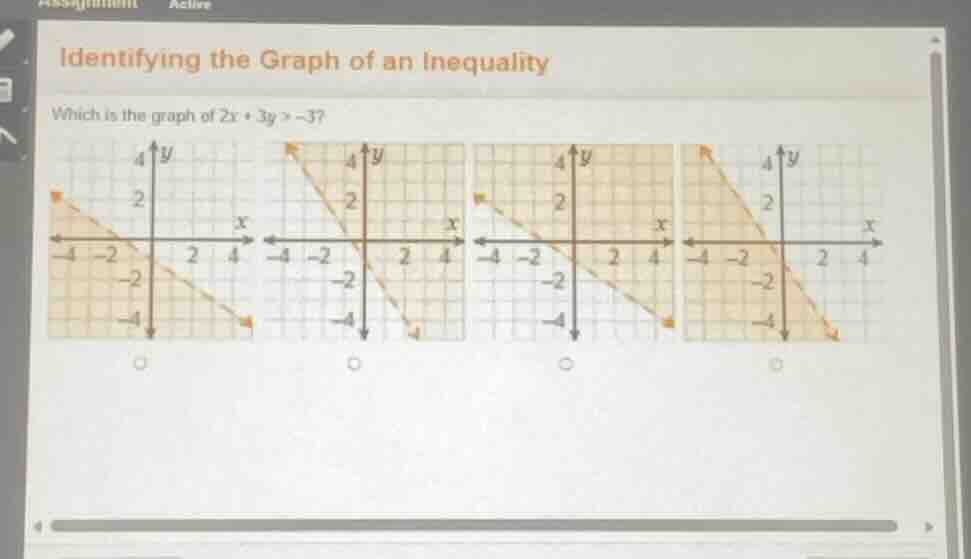
identifying the graph of an inequality
which is the graph of ( 2x + 3y > -3 )?
Step1: Rewrite inequality to slope-intercept form
Start with the given inequality:
$2x + 3y > -3$
Subtract $2x$ from both sides:
$3y > -2x - 3$
Divide by 3:
$y > -\frac{2}{3}x - 1$
Step2: Identify line type and direction
- The inequality uses $>$, so the boundary line is dashed (not solid, since values on the line are not included).
- The inequality $y >$ means we shade the region above the boundary line.
Step3: Verify boundary line points
The boundary line $y = -\frac{2}{3}x - 1$ has:
- Y-intercept at $(0, -1)$
- When $x = 3$, $y = -\frac{2}{3}(3) - 1 = -3$, so point $(3, -3)$
This matches the dashed line in the options.
Step4: Match shading to inequality
We need shading above the dashed line.

Snap & solve any problem in the app
Get step-by-step solutions on Sovi AI
Photo-based solutions with guided steps
Explore more problems and detailed explanations
The correct graph is the third option (the one with a dashed line and shading above the line, covering the upper portion of the coordinate plane relative to the line).