QUESTION IMAGE
Question
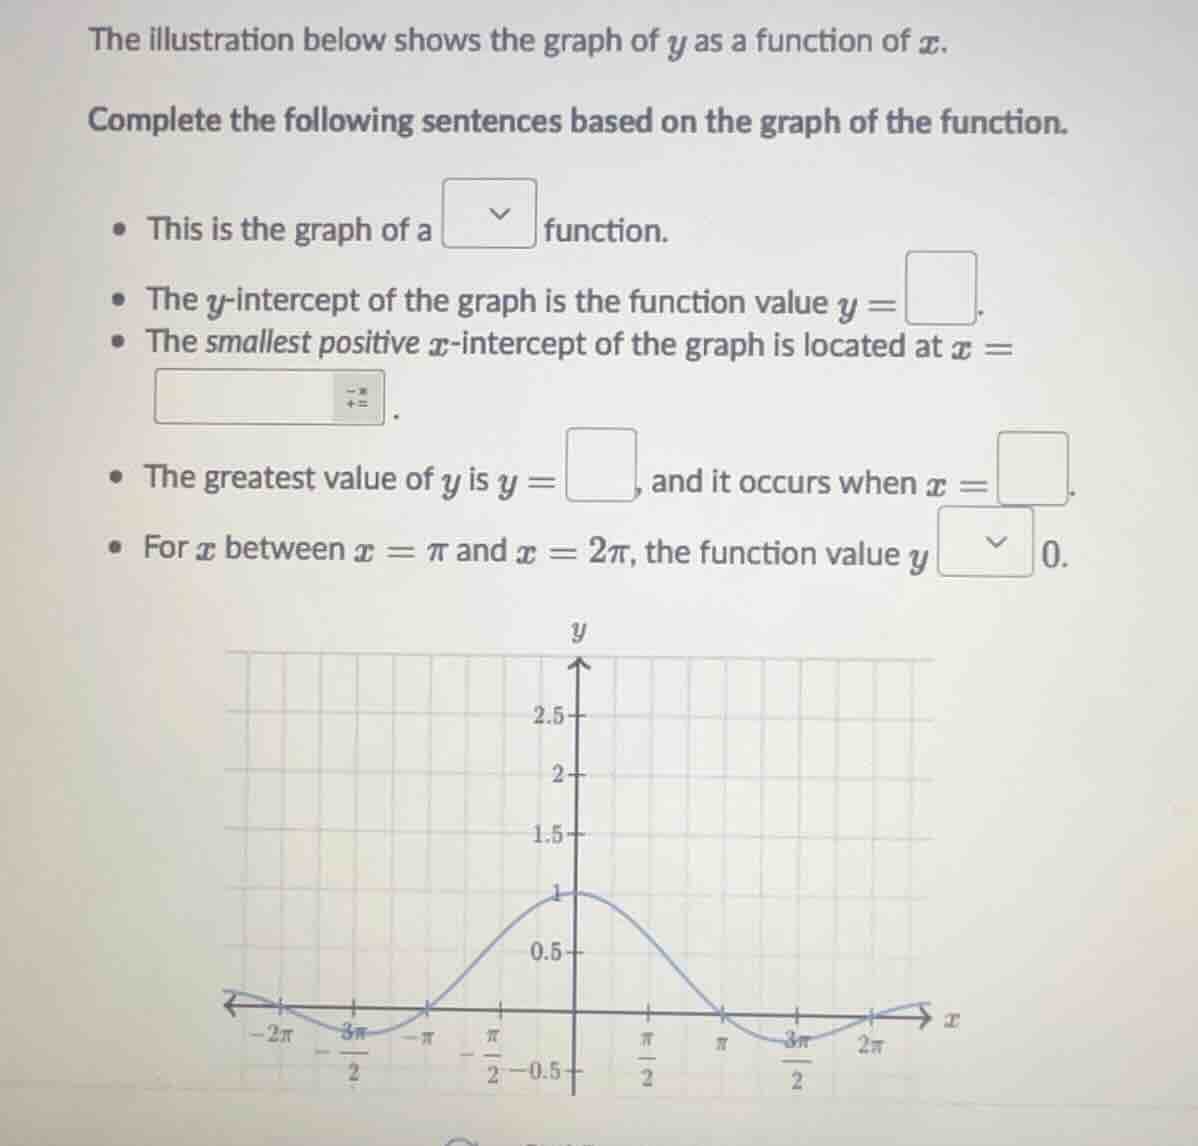
the illustration below shows the graph of $y$ as a function of $x$.
complete the following sentences based on the graph of the function.
- this is the graph of a $\boldsymbol{
abla}$ function.
- the $y$-intercept of the graph is the function value $y = \boldsymbol{square}$.
- the smallest positive $x$-intercept of the graph is located at $x = \boldsymbol{square}$.
- the greatest value of $y$ is $y = \boldsymbol{square}$, and it occurs when $x = \boldsymbol{square}$.
- for $x$ between $x = \pi$ and $x = 2\pi$, the function value $y$ $\boldsymbol{
abla}$ 0.
Step1: Identify function type
The graph is periodic, symmetric about the y-axis, has a maximum at x=0, and matches the shape of $y=\cos(x)$, so it is a cosine (or cosine-like periodic/even) function.
Step2: Find y-intercept
The y-intercept is where $x=0$. From the graph, $y=1$ at $x=0$.
Step3: Find smallest positive x-intercept
The x-intercepts are where $y=0$. The smallest positive x-value here is $x=\pi$.
Step4: Find maximum y and its x
The highest point on the graph is $y=1$, which occurs at $x=0$.
Step5: Analyze y between $\pi$ and $2\pi$
Between $x=\pi$ and $x=2\pi$, the graph is below the x-axis, so $y < 0$.

Snap & solve any problem in the app
Get step-by-step solutions on Sovi AI
Photo-based solutions with guided steps
Explore more problems and detailed explanations
- This is the graph of a cosine (even/periodic) function.
- The y-intercept of the graph is the function value $y=1$.
- The smallest positive x-intercept of the graph is located at $x=\pi$.
- The greatest value of $y$ is $y=1$, and it occurs when $x=0$.
- For $x$ between $x=\pi$ and $x=2\pi$, the function value $y < 0$.