QUESTION IMAGE
Question
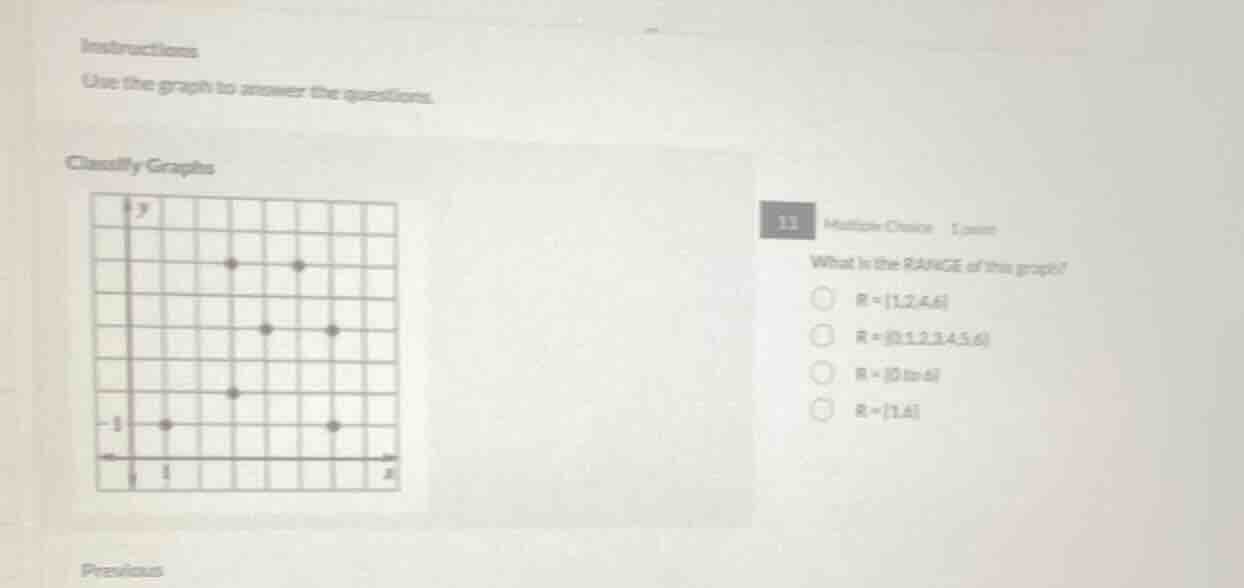
instructions
use the graph to answer the questions.
classify graphs
11 multiple choice 1 point
what is the range of this graph?
○ ( r = {1,2,4,6} )
○ ( r = {0,1,2,3,4,5,6} )
○ ( r = {0 \text{ to } 6} )
○ ( r = {1,6} )
Step1: Recall the definition of range
The range of a graph (a set of points) is the set of all the \( y \)-values of the points. So we need to identify the \( y \)-coordinates of each plotted point.
Step2: Identify the \( y \)-values from the graph
Looking at the graph (even though we can infer the points' \( y \)-values from the options and the grid), let's assume the points have \( y \)-values. Let's analyze the options:
- Option 1: \( R=\{1,2,4,6\} \) – let's check if these are \( y \)-values.
- Option 2: \( R=\{0,1,2,3,4,5,6\} \) – too many, not likely.
- Option 3: \( R=\{0 \text{ to } 6\} \) – range is a set of discrete values here (points), not a continuous interval.
- Option 4: \( R=\{1,6\} \) – too few.
From the graph (plotted points), the \( y \)-values of the points are 1, 2, 4, 6 (assuming the grid and the plotted dots). So the range is the set of these \( y \)-values.

Snap & solve any problem in the app
Get step-by-step solutions on Sovi AI
Photo-based solutions with guided steps
Explore more problems and detailed explanations
\( R = \{1,2,4,6\} \) (the first option, so the correct option is the one with \( R = \{1,2,4,6\} \))