QUESTION IMAGE
Question
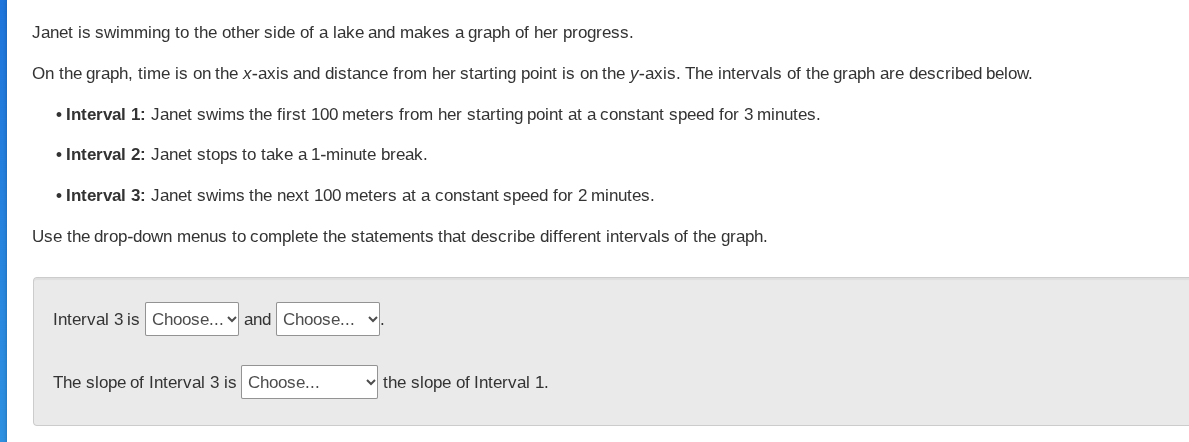
janet is swimming to the other side of a lake and makes a graph of her progress.
on the graph, time is on the x-axis and distance from her starting point is on the y-axis. the intervals of the graph are described below.
- interval 1: janet swims the first 100 meters from her starting point at a constant speed for 3 minutes.
- interval 2: janet stops to take a 1-minute break.
- interval 3: janet swims the next 100 meters at a constant speed for 2 minutes.
use the drop-down menus to complete the statements that describe different intervals of the graph.
interval 3 is choose... and choose...
the slope of interval 3 is choose... the slope of interval 1.
Step1: Analyze Interval 3's graph type
Janet swims 100 meters (increasing distance) over 2 minutes (increasing time) at constant speed. A constant speed with increasing distance over time creates a linear (straight line) graph with a positive slope, so it is increasing and linear.
Step2: Calculate slope of Interval 1
Slope = $\frac{\text{Change in distance}}{\text{Change in time}}$ = $\frac{100}{3} \approx 33.33$ meters per minute
Step3: Calculate slope of Interval 3
Slope = $\frac{\text{Change in distance}}{\text{Change in time}}$ = $\frac{100}{2} = 50$ meters per minute
Step4: Compare the two slopes
Since $50 > 33.33$, the slope of Interval 3 is greater than that of Interval 1.

Snap & solve any problem in the app
Get step-by-step solutions on Sovi AI
Photo-based solutions with guided steps
Explore more problems and detailed explanations
Interval 3 is increasing and linear.
The slope of Interval 3 is greater than the slope of Interval 1.