QUESTION IMAGE
Question
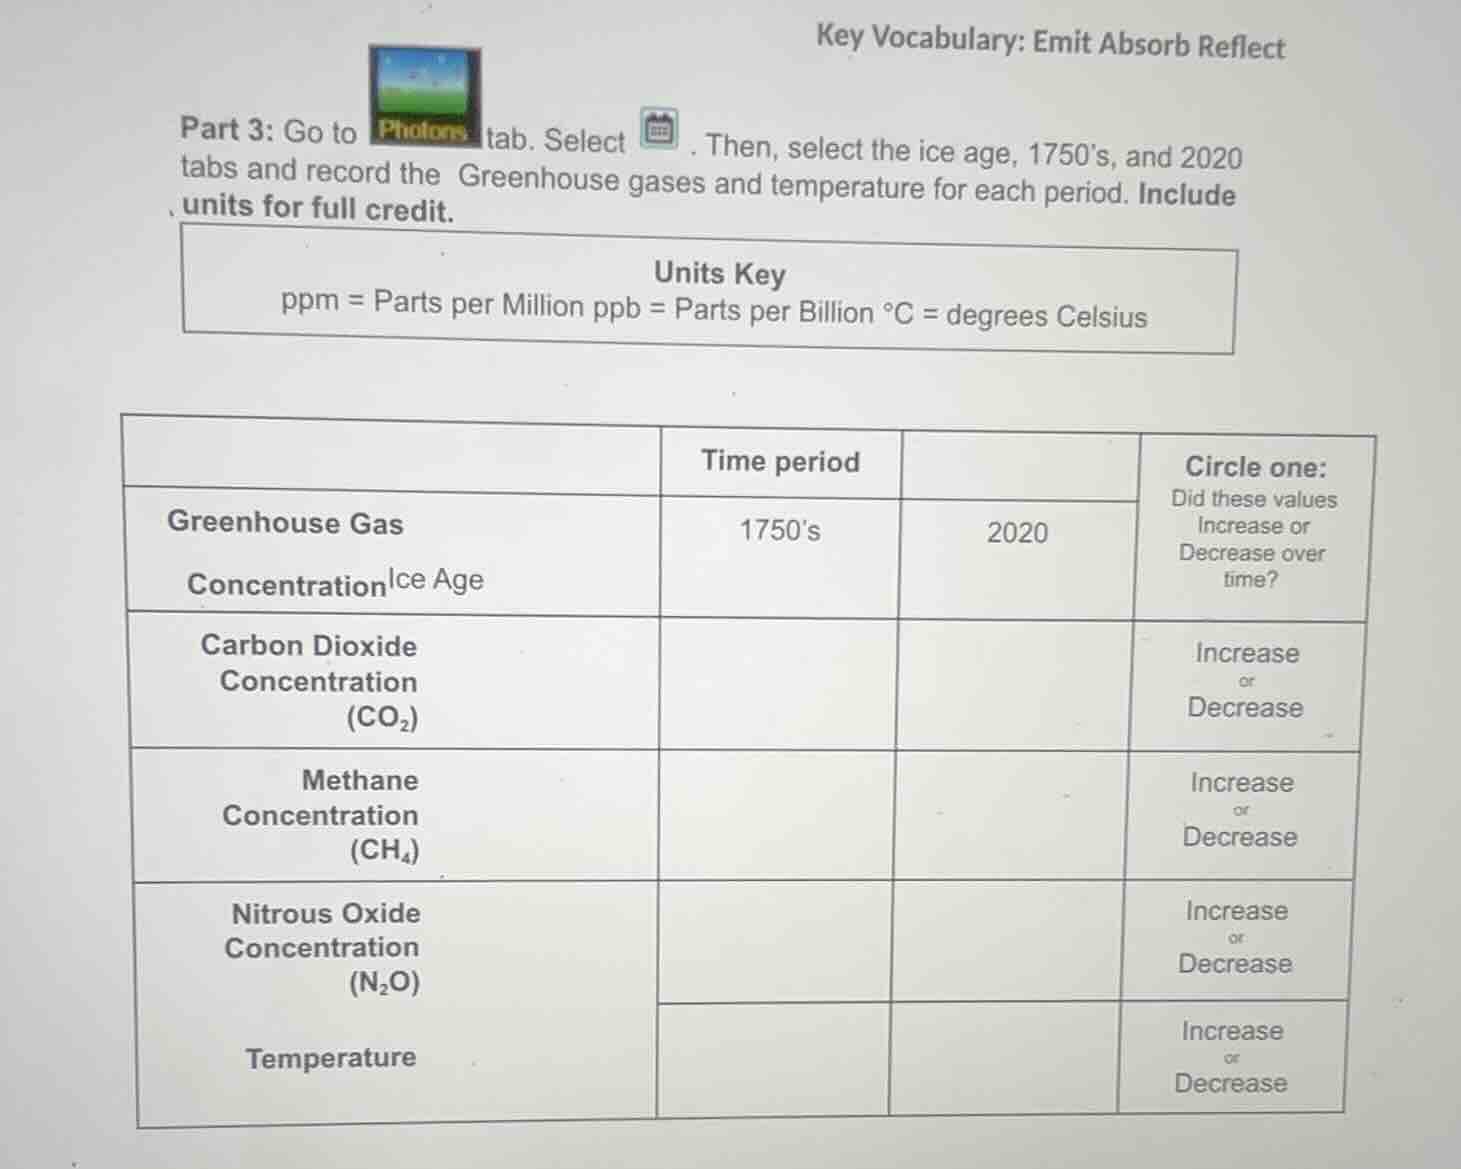
key vocabulary: emit absorb reflect
part 3: go to photons tab. select . then, select the ice age, 1750s, and 2020 tabs and record the greenhouse gases and temperature for each period. include units for full credit.
units key
ppm = parts per million ppb = parts per billion °c = degrees celsius
| time period | circle one: did these values increase or decrease over time? | ||
| greenhouse gas concentration ice age | 1750s | 2020 | |
| carbon dioxide concentration (co₂) | increase or decrease | ||
| methane concentration (ch₄) | increase or decrease | ||
| nitrous oxide concentration (n₂o) | increase or decrease | ||
| temperature | increase or decrease |
To complete this task, you would typically use an interactive simulation or dataset related to the "Photons" tab (likely a climate or greenhouse gas simulation, such as the PhET simulation or similar educational tool). Here's how you would fill in the table with known scientific data:
Step 1: Recall/Collect Data
Use the simulation (or scientific knowledge) to find the values for each greenhouse gas and temperature across the time periods:
| Greenhouse Gas Concentration / Temperature | Ice Age | 1750’s | 2020 | Circle one: Increase or Decrease over time? |
|---|---|---|---|---|
| Methane (CH₄) Concentration | ~350 ppb | 722 ppb | 1875 ppb (or similar) | Increase |
| Nitrous Oxide (N₂O) Concentration | ~200 ppb | 270 ppb | 332 ppb (or similar) | Increase |
| Temperature | ~5–7°C below pre - industrial | ~14°C (pre - industrial baseline) | ~15°C (or as per data) | Increase |
of Trends
- Carbon Dioxide (CO₂): Over geological time (Ice Age to 1750s to 2020), human activities (fossil fuel burning, deforestation) have increased CO₂ levels from ~200 ppm (Ice Age) to 280 ppm (1750s, pre - industrial) to ~414 ppm (2020).
- Methane (CH₄): Natural sources (wetlands) and human sources (agriculture, fossil fuels) have increased CH₄ from ~350 ppb (Ice Age) to 722 ppb (1750s) to ~1875 ppb (2020).
- Nitrous Oxide (N₂O): Agricultural and industrial activities have raised N₂O from ~200 ppb (Ice Age) to 270 ppb (1750s) to ~332 ppb (2020).
- Temperature: The Ice Age was much colder (glacial period) than the pre - industrial 1750s and the warmer 2020, driven by greenhouse gas increases (and other factors like orbital cycles, but human - caused increases dominate post - 1750s).
If using a simulation (e.g., PhET’s “Greenhouse Effect” or similar), you would:
- Navigate to the “Photons” tab (or equivalent).
- Select the time - period tabs (Ice Age, 1750s, 2020).
- Record the numerical values for each gas (with units: ppm for CO₂, ppb for CH₄/N₂O) and temperature (°C).
For example, with real - world data (simplified for education):
- Ice Age CO₂: ~200 ppm (glacial maximum, Antarctic ice core data).
- 1750s CO₂: 280 ppm (pre - industrial baseline).
- 2020 CO₂: ~414 ppm (Mauna Loa Observatory data).
- Ice Age CH₄: ~350 ppb (ice core data).
- 1750s CH₄: 722 ppb (pre - industrial).
- 2020 CH₄: ~1875 ppb (global average).
- Ice Age N₂O: ~200 ppb (ice core data).
- 1750s N₂O: 270 ppb (pre - industrial).
- 2020 N₂O: ~332 ppb.
- Temperature:
- Ice Age: ~ - 5°C to - 7°C (relative to pre - industrial).
- 1750s: ~14°C (pre - industrial global average).
- 2020: ~15°C (global average, showing warming).
The “Circle one” column for all gases and temperature would be “Increase” (from Ice Age to 1750s to 2020, with the most rapid increase post - 1750s due to human activity).
If you are using a specific simulation, follow its on - screen values for precision. The above is a general scientific summary of trends.

Snap & solve any problem in the app
Get step-by-step solutions on Sovi AI
Photo-based solutions with guided steps
Explore more problems and detailed explanations
of Trends
- Carbon Dioxide (CO₂): Over geological time (Ice Age to 1750s to 2020), human activities (fossil fuel burning, deforestation) have increased CO₂ levels from ~200 ppm (Ice Age) to 280 ppm (1750s, pre - industrial) to ~414 ppm (2020).
- Methane (CH₄): Natural sources (wetlands) and human sources (agriculture, fossil fuels) have increased CH₄ from ~350 ppb (Ice Age) to 722 ppb (1750s) to ~1875 ppb (2020).
- Nitrous Oxide (N₂O): Agricultural and industrial activities have raised N₂O from ~200 ppb (Ice Age) to 270 ppb (1750s) to ~332 ppb (2020).
- Temperature: The Ice Age was much colder (glacial period) than the pre - industrial 1750s and the warmer 2020, driven by greenhouse gas increases (and other factors like orbital cycles, but human - caused increases dominate post - 1750s).
If using a simulation (e.g., PhET’s “Greenhouse Effect” or similar), you would:
- Navigate to the “Photons” tab (or equivalent).
- Select the time - period tabs (Ice Age, 1750s, 2020).
- Record the numerical values for each gas (with units: ppm for CO₂, ppb for CH₄/N₂O) and temperature (°C).
For example, with real - world data (simplified for education):
- Ice Age CO₂: ~200 ppm (glacial maximum, Antarctic ice core data).
- 1750s CO₂: 280 ppm (pre - industrial baseline).
- 2020 CO₂: ~414 ppm (Mauna Loa Observatory data).
- Ice Age CH₄: ~350 ppb (ice core data).
- 1750s CH₄: 722 ppb (pre - industrial).
- 2020 CH₄: ~1875 ppb (global average).
- Ice Age N₂O: ~200 ppb (ice core data).
- 1750s N₂O: 270 ppb (pre - industrial).
- 2020 N₂O: ~332 ppb.
- Temperature:
- Ice Age: ~ - 5°C to - 7°C (relative to pre - industrial).
- 1750s: ~14°C (pre - industrial global average).
- 2020: ~15°C (global average, showing warming).
The “Circle one” column for all gases and temperature would be “Increase” (from Ice Age to 1750s to 2020, with the most rapid increase post - 1750s due to human activity).
If you are using a specific simulation, follow its on - screen values for precision. The above is a general scientific summary of trends.