QUESTION IMAGE
Question
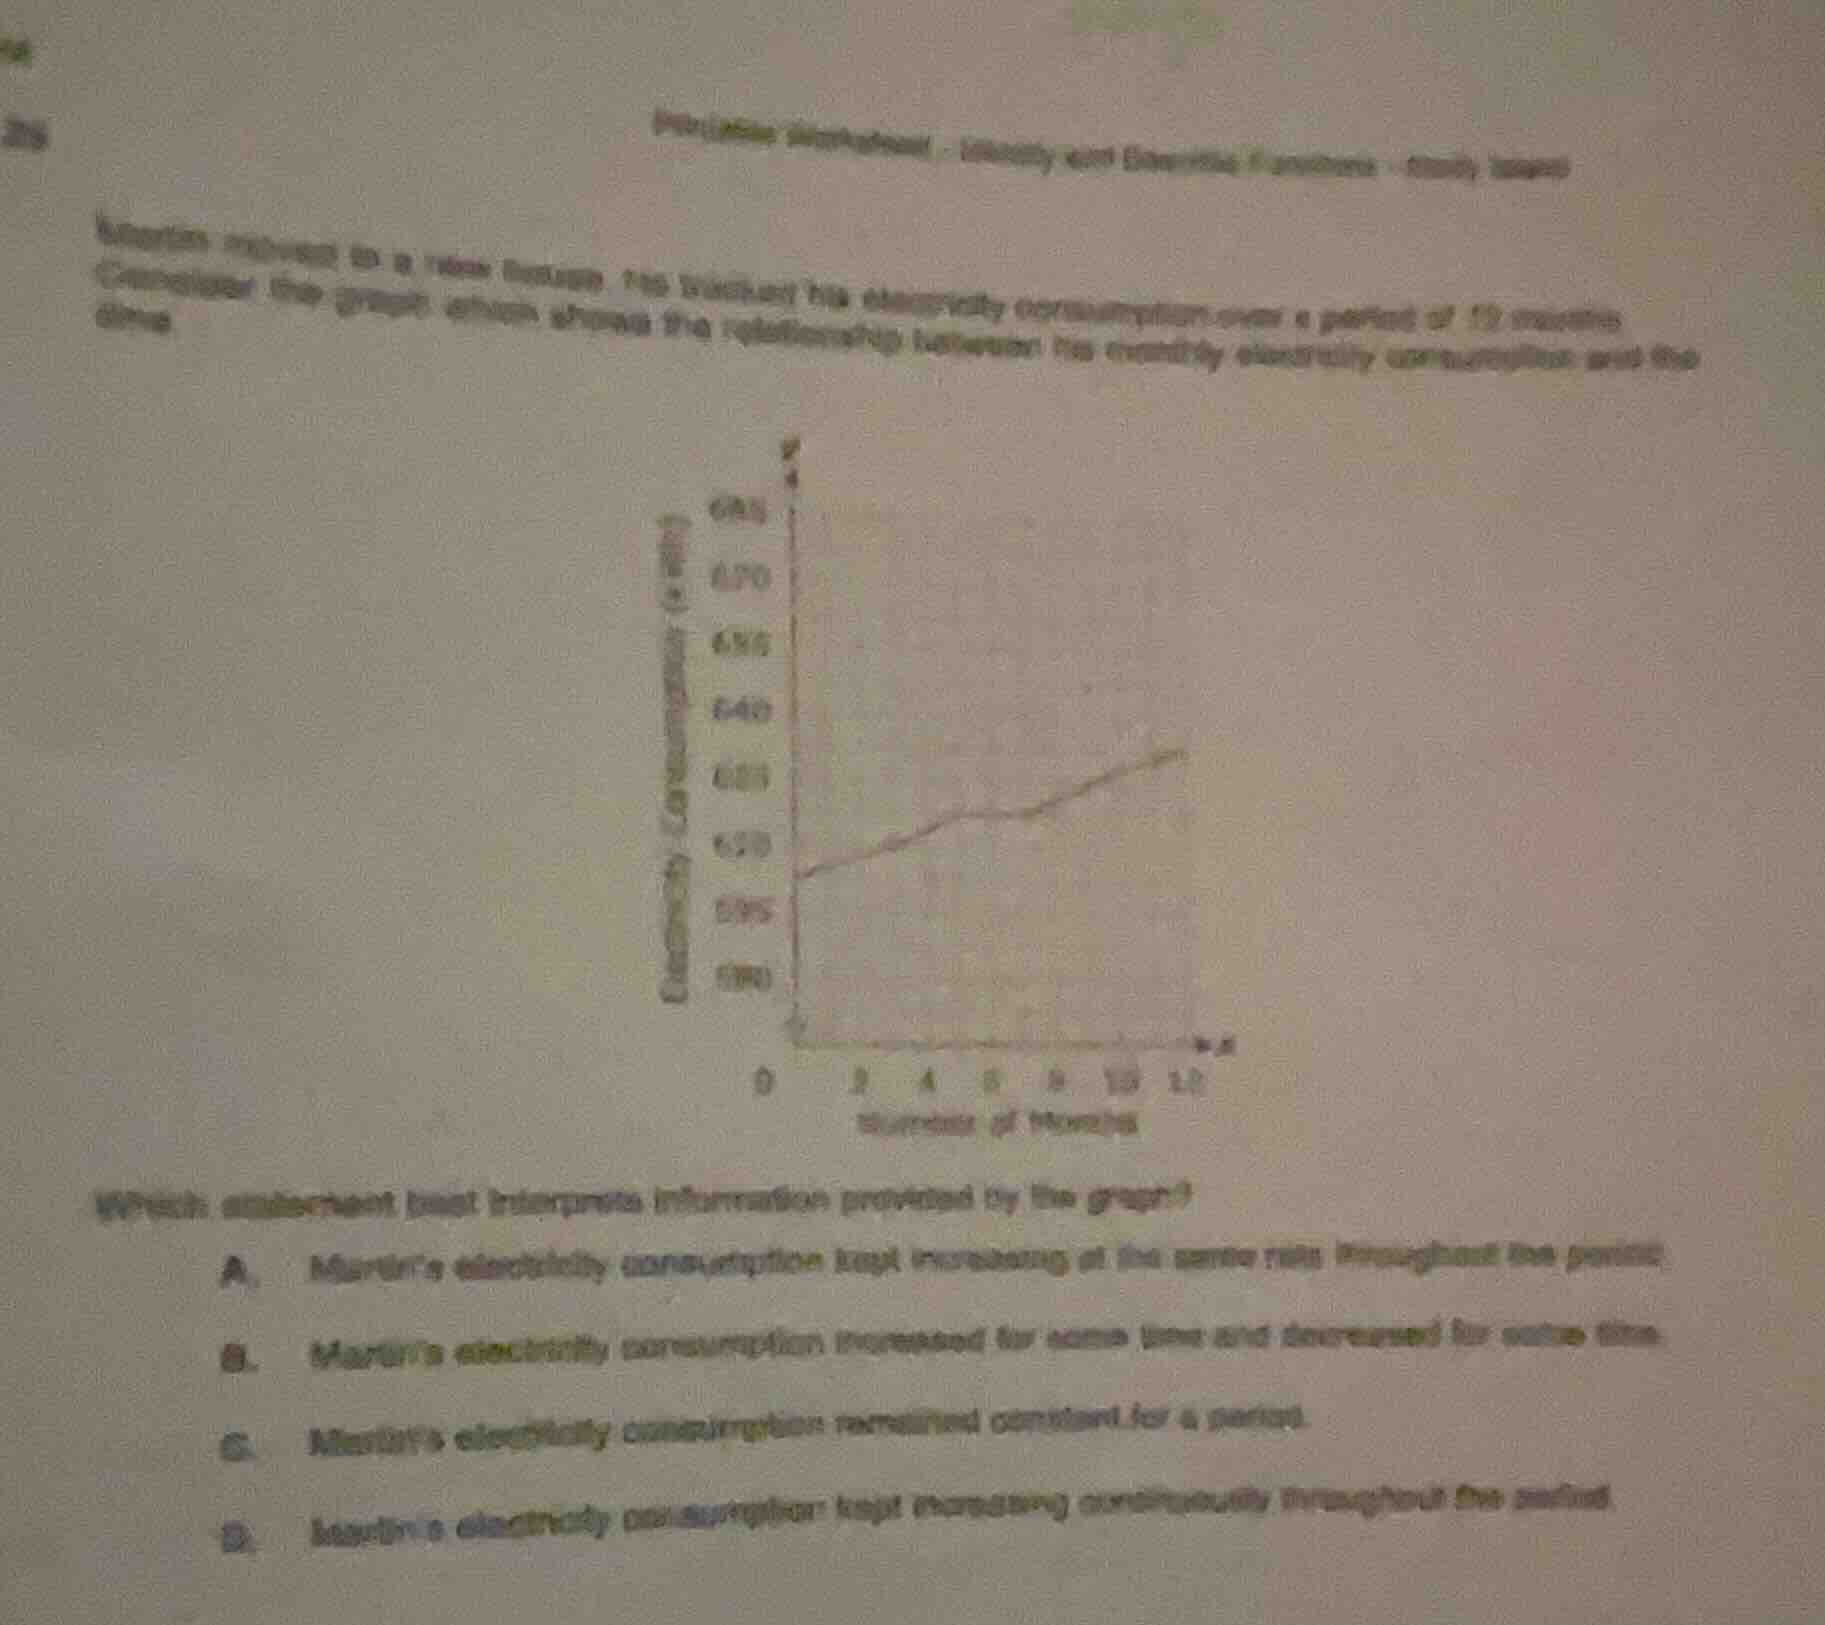
martin moved to a new house. he tracked his electricity consumption over a period of 12 months. consider the graph shown shows the relationship between his monthly electricity consumption and the time. which statement best interprets information provided by the graph? a. martins electricity consumption kept increasing at the same rate throughout the period. b. martins electricity consumption increased for some time and decreased for other time. c. martins electricity consumption remained constant for a period. d. martins electricity consumption kept increasing continuously throughout the period.
Analyze the graph's trend: it shows a continuous upward curve with no flat (constant) or downward segments, and the slope changes so the rate is not uniform.
- Option A is wrong: the rate of increase is not the same (slope varies).
- Option B is wrong: consumption never decreases.
- Option C is wrong: consumption never stays constant.
- Option D is correct: consumption rises continuously over the 12 months.

Snap & solve any problem in the app
Get step-by-step solutions on Sovi AI
Photo-based solutions with guided steps
Explore more problems and detailed explanations
D. Martin's electricity consumption kept increasing continuously throughout the period.