QUESTION IMAGE
Question
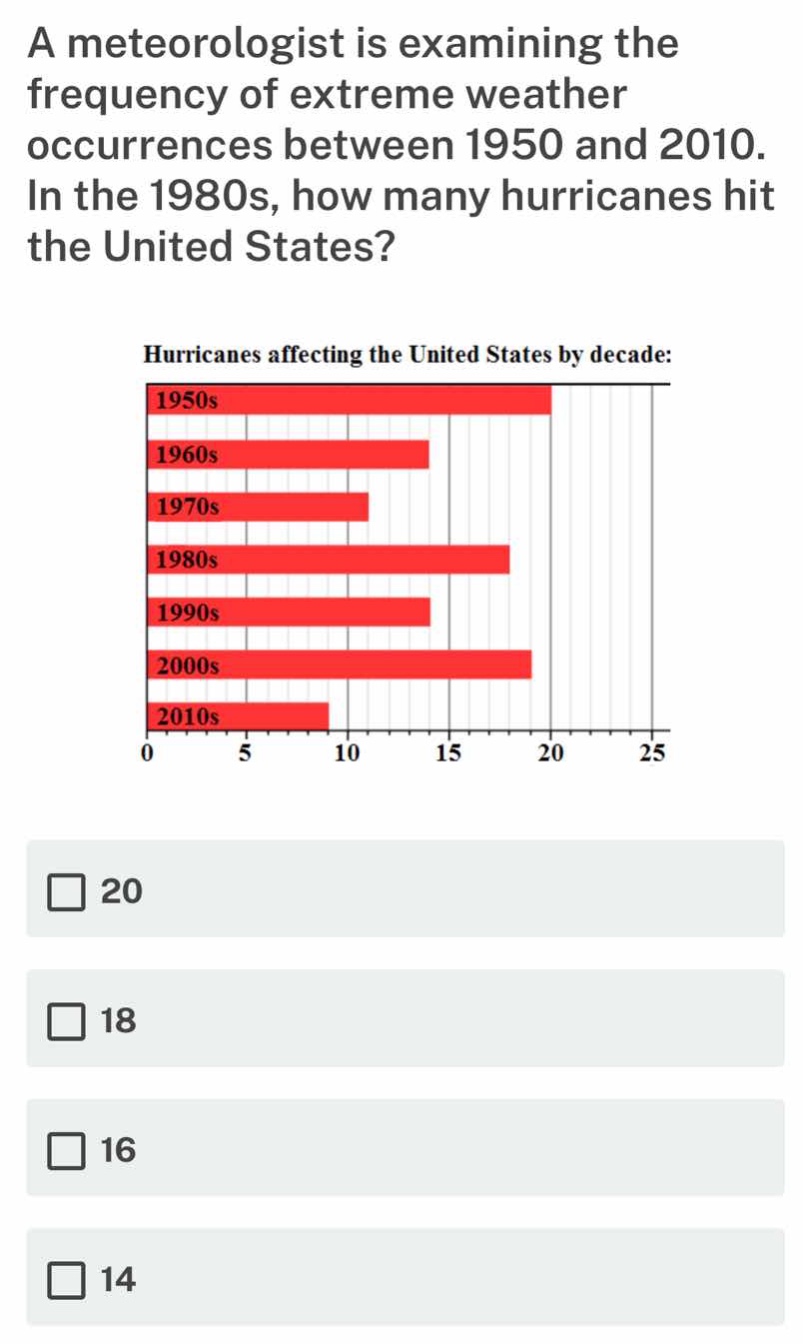
a meteorologist is examining the frequency of extreme weather occurrences between 1950 and 2010. in the 1980s, how many hurricanes hit the united states?
hurricanes affecting the united states by decade:
bar graph showing hurricanes per decade: 1950s ~20, 1960s ~14, 1970s ~10, 1980s ~18, 1990s ~14, 2000s ~19, 2010s ~8
options: 20, 18, 16, 14
Brief Explanations
Locate the 1980s bar on the horizontal bar graph, then read its corresponding value on the x-axis (frequency scale). The bar aligns with the 18 mark.

Snap & solve any problem in the app
Get step-by-step solutions on Sovi AI
Photo-based solutions with guided steps
Explore more problems and detailed explanations
18