QUESTION IMAGE
Question
4 multiple choice 0.5 points
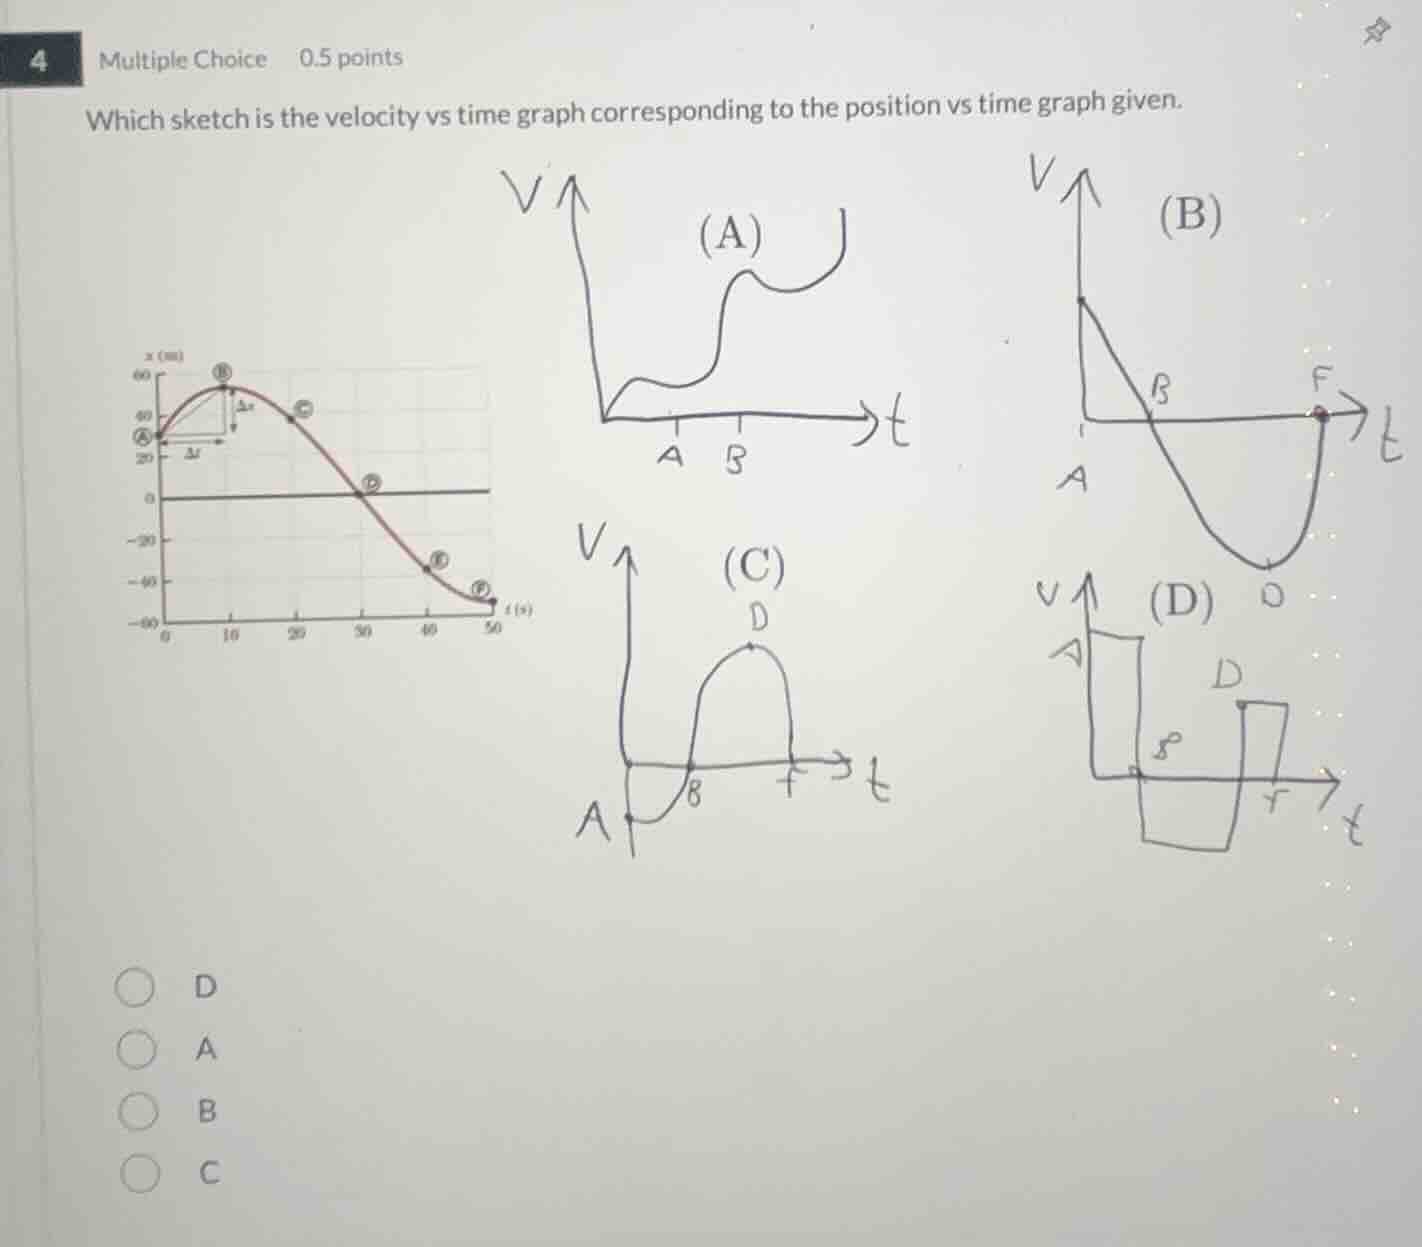
which sketch is the velocity vs time graph corresponding to the position vs time graph given.
options:
d
a
b
c
Step1: Relate x-t slope to velocity
Velocity $v = \frac{\Delta x}{\Delta t}$, which is the slope of the position-time ($x$-$t$) graph.
Step2: Analyze x-t graph segment A→B
From A to B: $x$ increases, slope is positive and decreasing (curving toward t-axis), so $v>0$ and decreasing.
Step3: Analyze x-t graph at point B
At B: Slope of $x$-$t$ graph is 0, so $v=0$.
Step4: Analyze x-t graph segment B→F
From B to F: $x$ first decreases slowly, then faster, then slower. Slope is negative, first becomes more negative, then less negative, so $v<0$, first decreasing (more negative), then increasing (approaching 0).
Step5: Match to v-t options
This matches graph B: positive initial $v$, decreases to 0 at B, then becomes negative, reaches a minimum (most negative) at D, then increases back to 0 at F.

Snap & solve any problem in the app
Get step-by-step solutions on Sovi AI
Photo-based solutions with guided steps
Explore more problems and detailed explanations
B