QUESTION IMAGE
Question
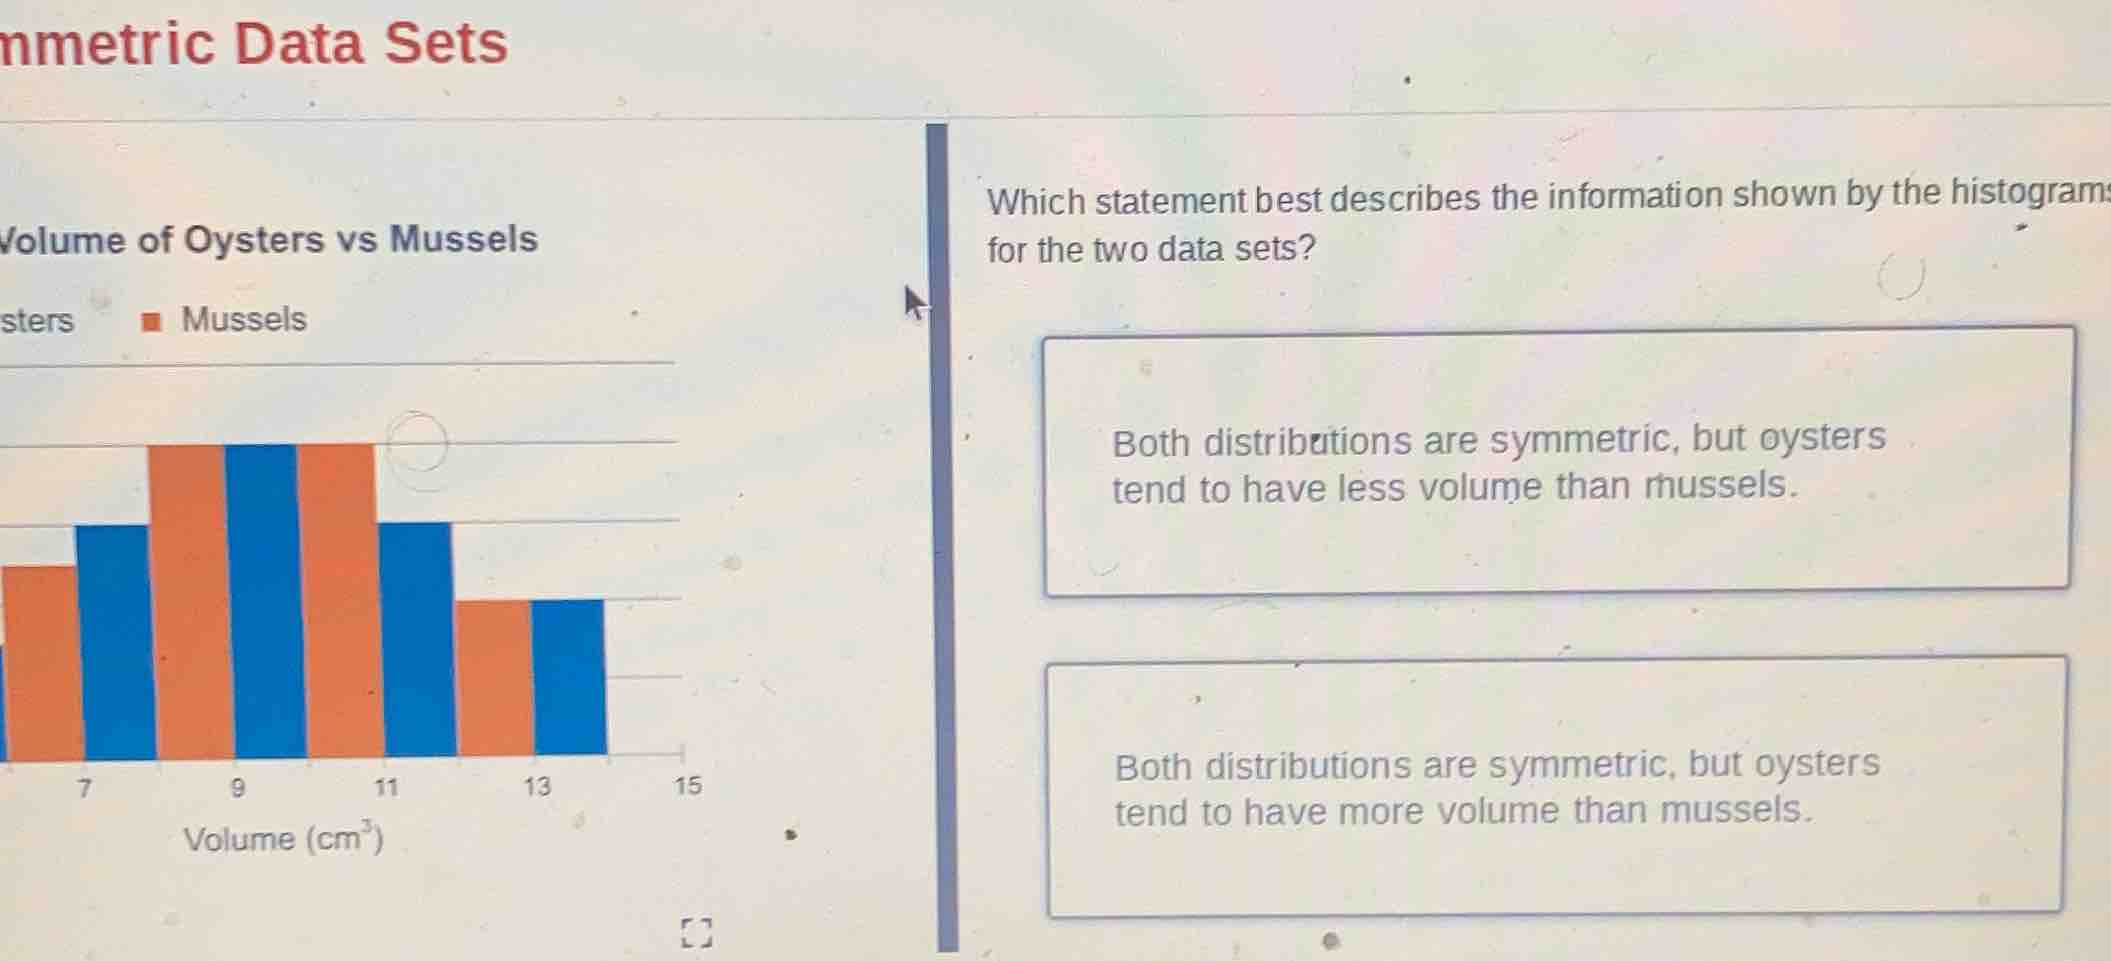
nmetric data sets
volume of oysters vs mussels
sters ■ mussels
7 9 11 13 15
volume (cm³)
which statement best describes the information shown by the histograms for the two data sets?
both distributions are symmetric, but oysters tend to have less volume than mussels.
both distributions are symmetric, but oysters tend to have more volume than mussels.
Brief Explanations
To determine the correct statement, we analyze the histogram:
- Symmetry Check: A symmetric distribution has data evenly distributed around the center. Both oysters (orange) and mussels (blue) histograms appear symmetric (mirror - like around the middle bar).
- Volume Comparison: For lower volume values (e.g., around 7 - 8 \(cm^3\)), the oyster bars are taller, meaning more oysters have lower volumes. For higher volume values (e.g., around 12 - 13 \(cm^3\)), the mussel bars are taller, meaning more mussels have higher volumes. So overall, oysters tend to have less volume than mussels.

Snap & solve any problem in the app
Get step-by-step solutions on Sovi AI
Photo-based solutions with guided steps
Explore more problems and detailed explanations
The statement "Both distributions are symmetric, but oysters tend to have less volume than mussels." (the first option) best describes the information shown by the histograms.