QUESTION IMAGE
Question
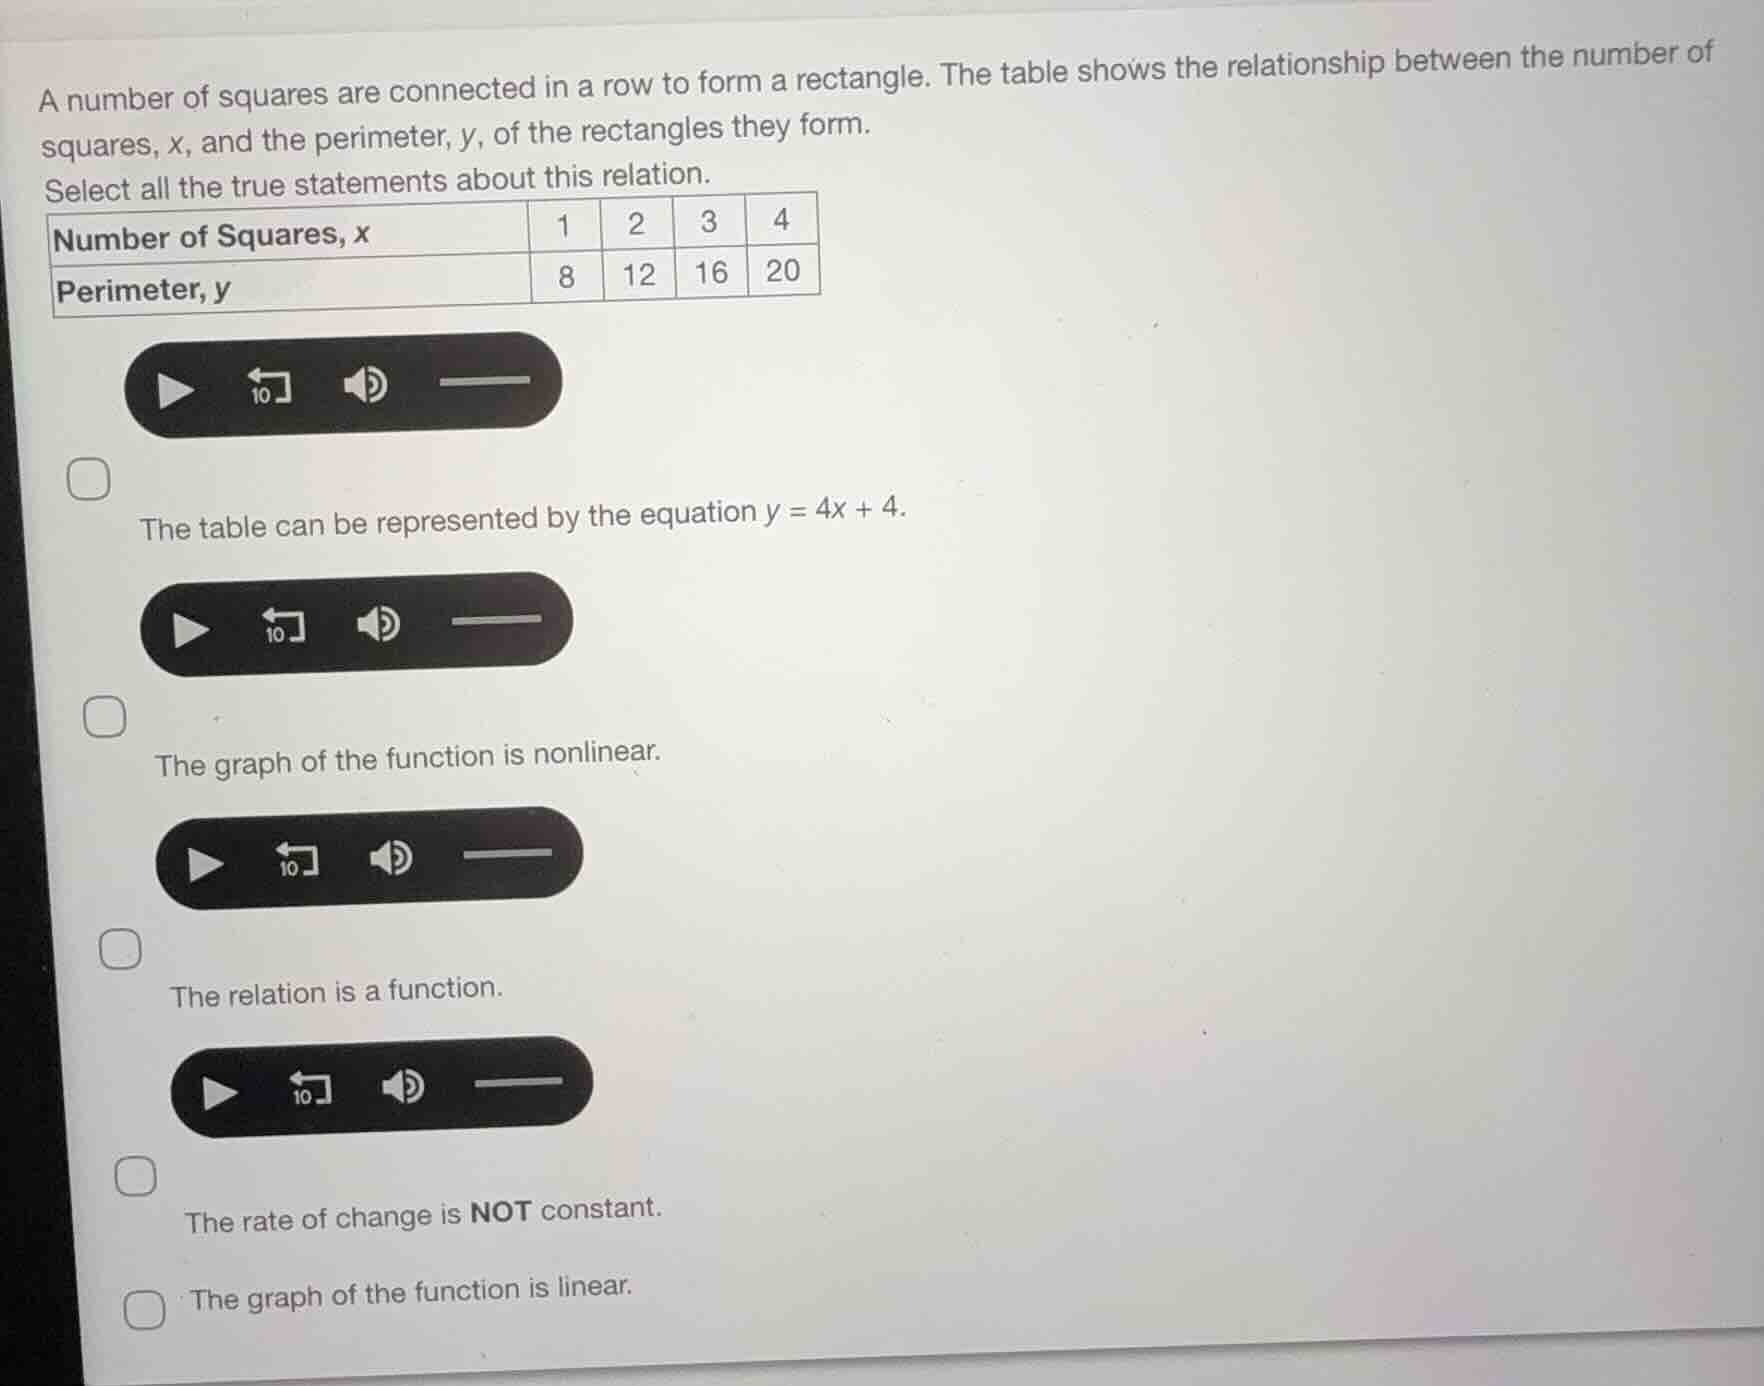
a number of squares are connected in a row to form a rectangle. the table shows the relationship between the number of squares, x, and the perimeter, y, of the rectangles they form. select all the true statements about this relation.
number of squares, x | 1 | 2 | 3 | 4
perimeter, y | 8 | 12 | 16 | 20
- the table can be represented by the equation $y = 4x + 4$.
- the graph of the function is nonlinear.
- the relation is a function.
- the rate of change is not constant.
- the graph of the function is linear.
Step1: Verify the equation $y=4x+4$
Test each $x$ value:
- $x=1$: $y=4(1)+4=8$ (matches table)
- $x=2$: $y=4(2)+4=12$ (matches table)
- $x=3$: $y=4(3)+4=16$ (matches table)
- $x=4$: $y=4(4)+4=20$ (matches table)
Step2: Check linearity of the function
The equation $y=4x+4$ is in the form $y=mx+b$ (linear), so the graph is linear, not nonlinear.
Step3: Check if the relation is a function
Each $x$ value has exactly one $y$ value, so it is a function.
Step4: Check rate of change
Rate of change $m=4$ (from $y=4x+4$), which is constant. So the statement "rate of change is NOT constant" is false.

Snap & solve any problem in the app
Get step-by-step solutions on Sovi AI
Photo-based solutions with guided steps
Explore more problems and detailed explanations
- The table can be represented by the equation $y = 4x + 4$.
- The relation is a function.
- The graph of the function is linear.