QUESTION IMAGE
Question
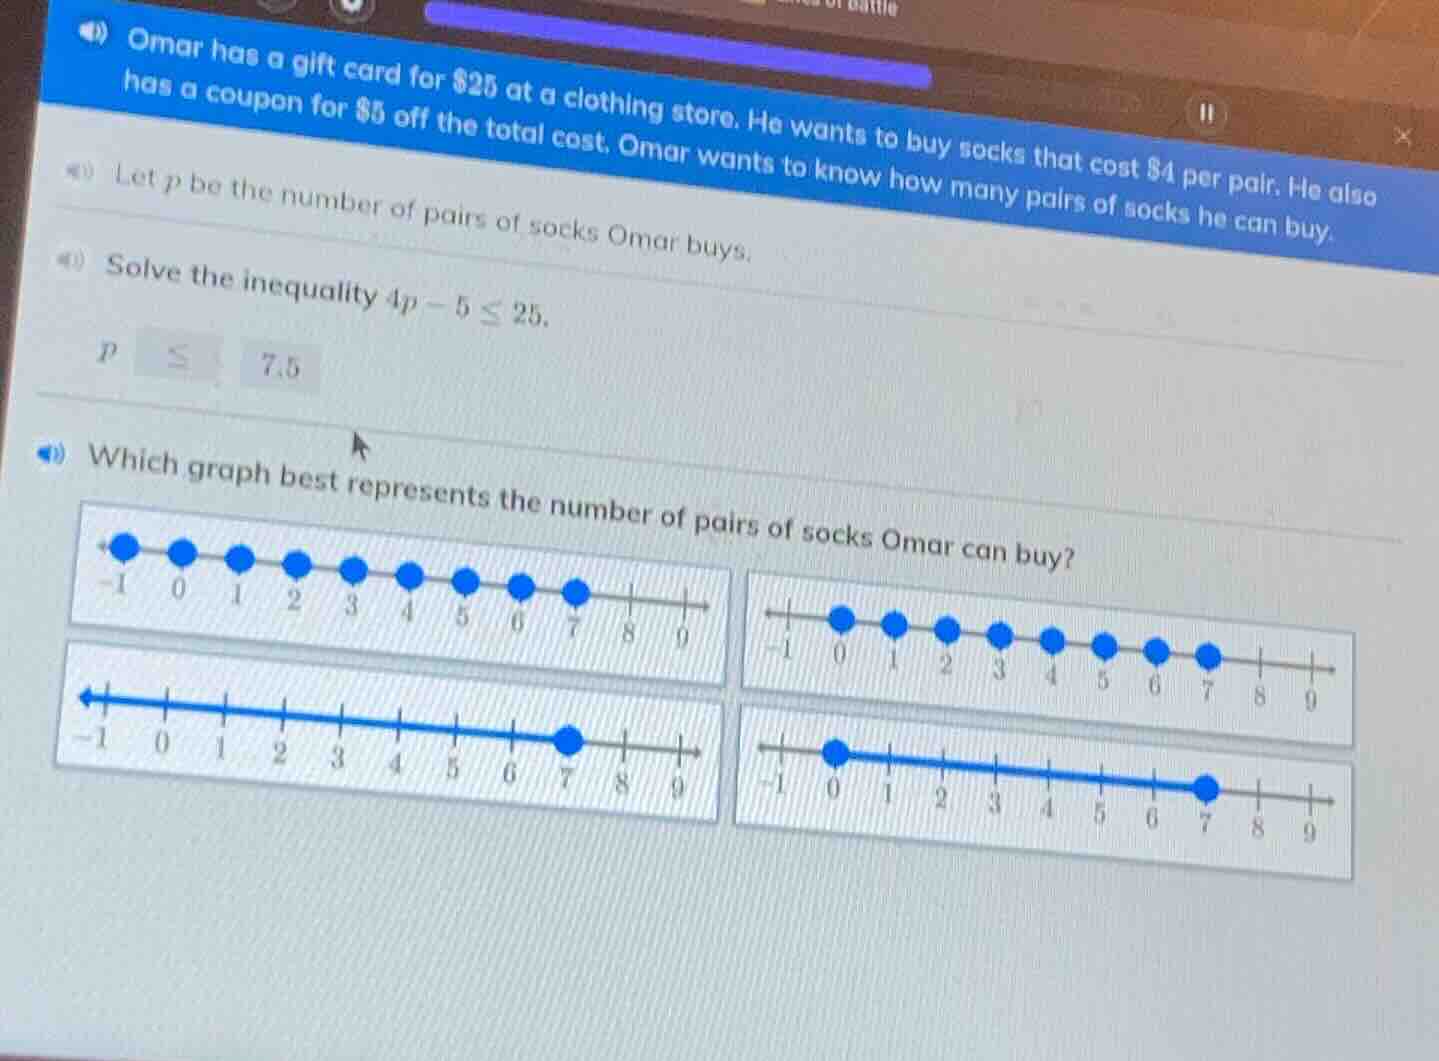
omar has a gift card for $25 at a clothing store. he wants to buy socks that cost $4 per pair. he also has a coupon for $5 off the total cost. omar wants to know how many pairs of socks he can buy. let p be the number of pairs of socks omar buys. solve the inequality 4p - 5 ≤ 25. p ≤ 7.5 which graph best represents the number of pairs of socks omar can buy?
Step1: Analyze the inequality solution
We found that \( p \leq 7.5 \). Since \( p \) represents the number of pairs of socks, \( p \) must be a non - negative integer (you can't buy a negative number of socks or a fraction of a sock in a practical sense, but for the inequality graph, we first consider the solution to \( p\leq7.5\)).
Step2: Analyze the number line graphs
- The first graph: The dots are from - 1 to 7. But \( p \) (number of socks) can't be negative, so this is incorrect.
- The second graph: The dots are from 0 to 7. But our solution is \( p\leq7.5\), and since \( p\) is the number of pairs of socks (a non - negative real number in the context of the inequality, but in reality, it's a non - negative integer, but for the graph of the inequality \( p\leq7.5\)), we need a graph that shows all real numbers less than or equal to 7.5, with a closed dot at 7.5 (or 7 since we can't buy half a sock, but from the inequality \( 4p - 5\leq25\) which solves to \( p\leq7.5\)). Wait, looking at the options, the fourth graph (the one with a closed dot at 7 and the line going to the left from 7) is incorrect. Wait, let's re - evaluate. The inequality is \( p\leq7.5\). Since \( p\) is the number of pairs of socks, \( p\) must be a non - negative integer (0, 1, 2, …, 7). But the graphs:
- The third graph has an arrow to the left starting from 7, with a closed dot at 7. Wait, no, the third graph's arrow is to the left from a point before 0? No, looking at the graphs again. Wait, the correct graph should represent \( p\leq7.5\), and since \( p\) is the number of pairs of socks, \( p\) is a non - negative integer (0, 1, 2, …, 7). But among the given graphs, the second graph (the one with dots from 0 to 7) or the fourth? Wait, no, let's check the inequality solution again. We had \( 4p-5\leq25\).
- Solve \( 4p-5\leq25\):
- Add 5 to both sides: \( 4p\leq25 + 5=30\)
- Divide both sides by 4: \( p\leq\frac{30}{4}=7.5\)
- So \( p\) can be any non - negative real number less than or equal to 7.5. But since \( p\) is the number of pairs of socks, \( p\) is a non - negative integer (0, 1, 2, …, 7). Now looking at the graphs:
- The first graph: includes negative numbers, wrong.
- The second graph: dots from 0 to 7, which are the possible number of pairs (0,1,2,3,4,5,6,7), which is correct because \( p\leq7.5\) and \( p\geq0\) (can't buy negative socks). Wait, no, the second graph has dots at 0,1,2,3,4,5,6,7? Wait, the second graph's x - axis: from - 1 to 9, with dots at 0,1,2,3,4,5,6,7. The third graph has an arrow to the left from 7 (closed dot at 7), and the line is blue to the left. Wait, maybe the third graph is the one with a closed dot at 7 and the line going to the left (since \( p\leq7.5\), and 7.5 is close to 7, and since we can't buy 0.5 of a sock, the maximum number of socks is 7. So the graph that shows all integers from 0 to 7 (the second graph) or the graph with a closed dot at 7 and the line to the left (the third graph? No, the third graph's arrow is to the left from a point before 0? No, looking at the original graphs:
Wait, the correct graph should be the one where we have a closed dot at 7.5 (or 7, since we can't buy half a sock) and the line goes to the left. Among the given options, the second graph (the one with dots from 0 to 7) is incorrect. Wait, maybe I made a mistake. Let's look at the graphs again:
First graph: dots from - 1 to 7 (includes negative, wrong).
Second graph: dots from 0 to 7 (shows 0,1,2,3,4,5,6,7, which are the possible number of pairs of socks since \( p\…

Snap & solve any problem in the app
Get step-by-step solutions on Sovi AI
Photo-based solutions with guided steps
Explore more problems and detailed explanations
The graph with dots from 0 to 7 (the first row right graph)